How Many Cells in the Human Body? About Half Are Bacteria

Slide the ladder sideways to read its labels, or open it full size.
A gut bacterium: about 1–2 µm across [10−6 m]; cultured E. coli measure 1.0–1.5 µm wide and 1.6–3.9 µm long.
Log scale from 10 cm to 0.1 nm; each rung is ten times smaller than the one to its left. Dashed lines: naked eye about 0.1 mm and light microscope about 0.2 µm, explained on the Zoom ladder page. Bands: E. coli length and width across 22 growth conditions (Volkmer and Heinemann 2011).
"Zoom ladder: a gut bacterium" by Ants, Cells & Atoms, https://antscellsandatoms.com/scale/how-many-bacteria-in-the-human-body/ — CC BY 4.0 (https://creativecommons.org/licenses/by/4.0/)
Data: Volkmer B, Heinemann M 2011, PLoS ONE 6(7):e23126, CC BY 4.0, https://doi.org/10.1371/journal.pone.0023126 (Table 1: cell length 1.6-3.9 µm and width 1.0-1.5 µm across 22 growth conditions); subject size 1-2 µm from the article front matter zoom, same value as the Bench card; ladder drawn for this page 2026-10-24
Bench card
- Question
- How many bacteria live in and on a human body, compared with human cells?
- Method
- Sender 2016 chain recomputed with units, plus an independent route from stool solids; human count checked against Hatton 2023
- Inputs
- 10 (4 for the colon route, 4 for the stool route, 2 for the human red-cell count)Source: inputs table and CSV download on this page
- Key source
- Sender, Fuchs & Milo 2016, PLoS Biology
how-many-bacteria-in-the-human-body-bench.csv (CSV) · where each value comes from, and its license (JSON)
Data credits for this card
Data: Sender R, Fuchs S, Milo R 2016, PLoS Biology 14(8):e1002533, CC BY 4.0, https://doi.org/10.1371/journal.pbio.1002533 (retrieved 2026-10-24); Rose C, Parker A, Jefferson B, Cartmell E 2015, Critical Reviews in Environmental Science and Technology 45(17):1827-1879, CC BY 3.0, https://doi.org/10.1080/10643389.2014.1000761 (retrieved 2026-10-24); Hatton IA et al. 2023, Proceedings of the National Academy of Sciences 120(39):e2303077120, CC BY 4.0, https://doi.org/10.1073/pnas.2303077120 (retrieved 2026-10-24); answer range and input count computed 2026-10-24 for this page
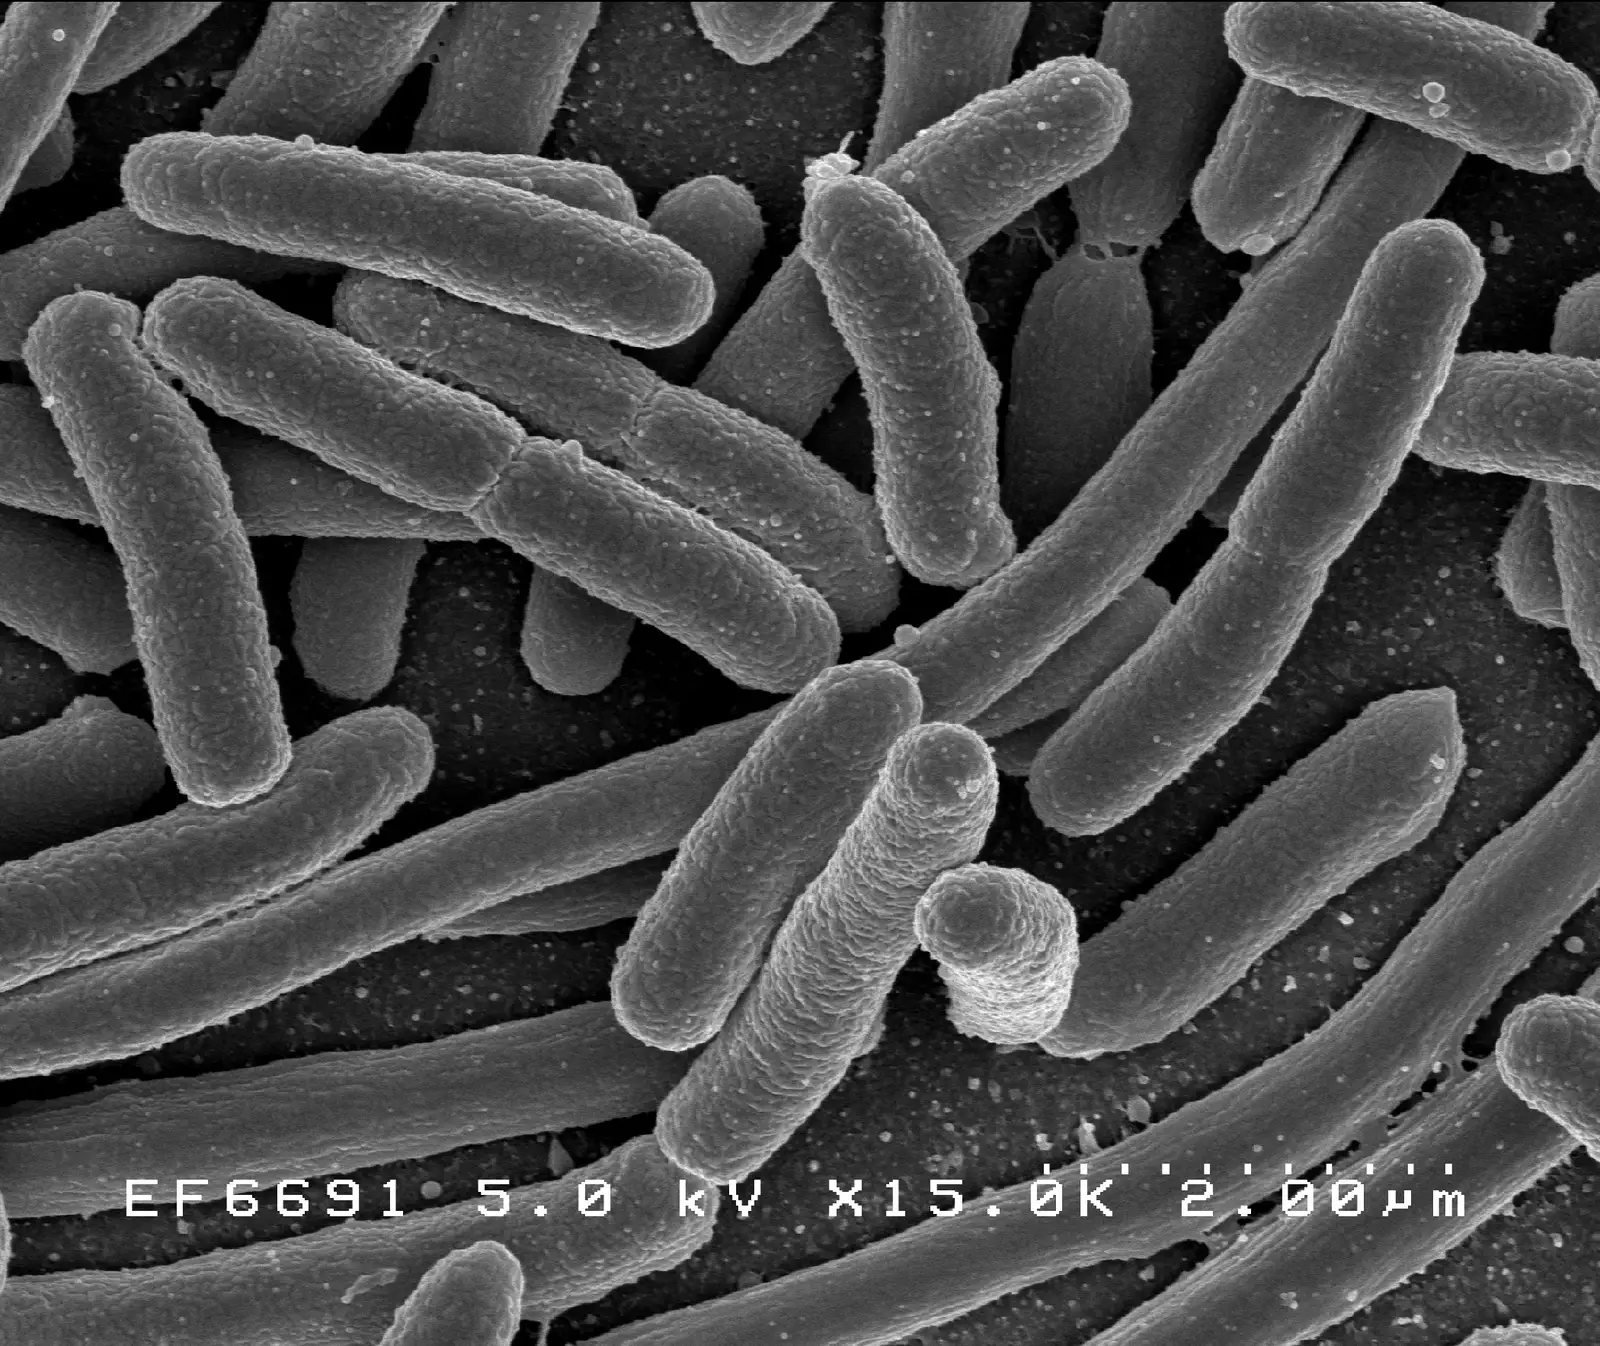
Escherichia coli grown in culture, scanning electron micrograph; cultured cells of this species run 1.0–1.5 µm wide and 1.6–3.9 µm long [10−6 m]. Size in this image: 2.00 µm instrument scale bar.
Color: native (electron micrograph, no color)
“E. coli Bacteria (7316101966)” by NIAID (2002) · Public domain
Full credit
"E. coli Bacteria (7316101966)" by NIAID (2002) — https://commons.wikimedia.org/wiki/File:E._coli_Bacteria_(7316101966).jpg — Public domain (work of a United States federal agency (NIAID, part of NIH), public domain in the United States under 17 U.S.C. §105; Commons tag PD-USGov-NIH-NIAID; Flickr source page credits NIAID with no contractor note; dated 2002-11-14 in the file metadata; no copyright term applies in the EU for a US government work released as public domain by its author agency (used as the source's explicit PD mark))

The ratio has a long history and a short arithmetic. In 2016 Ron Sender, Shai Fuchs and Ron Milo published a recount in PLoS Biology that lays out every input, its source and its uncertainty. This page is built on their figures. Where it recomputes something, it says computed; where it has only a bibliographic record of a paper, it says so.
How many bacteria, and how many human cells?
The two headline numbers belong to one specific body. That body is the "reference man" of radiation-protection tables: 20–30 years old, 70 kg, 170 cm tall. For him, Sender and colleagues estimate about 3.8×10¹³ bacteria and about 3.0×10¹³ human cells, a bacteria-to-human ratio of about 1.3.
They put the uncertainty of that ratio at about 25% and the spread among 70 kg men at about 53%. The two percentages measure different things. One is the estimate's error; the other, the variation between people. Computed for this page, 3.8×10¹³ out of 6.8×10¹³ is 56%, which is the "about half" in the title.
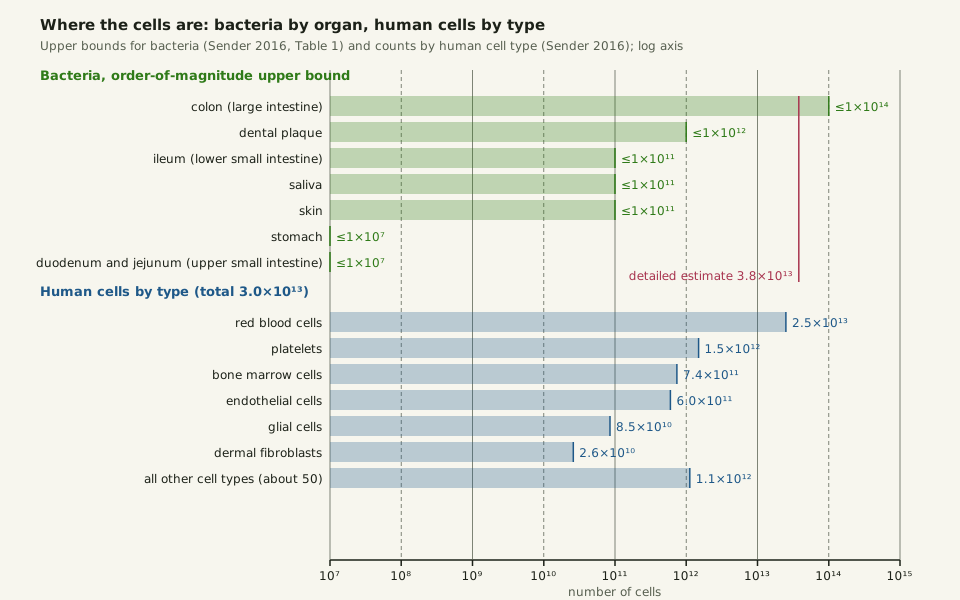
Almost all of the bacteria are in one place. Sender and colleagues multiply measured bacterial concentrations by organ volumes to get order-of-magnitude upper bounds. The colon comes to 1014 at most, dental plaque to 1012, and saliva, skin and the lower small intestine to 1011 each. The stomach and upper small intestine reach only about 107.
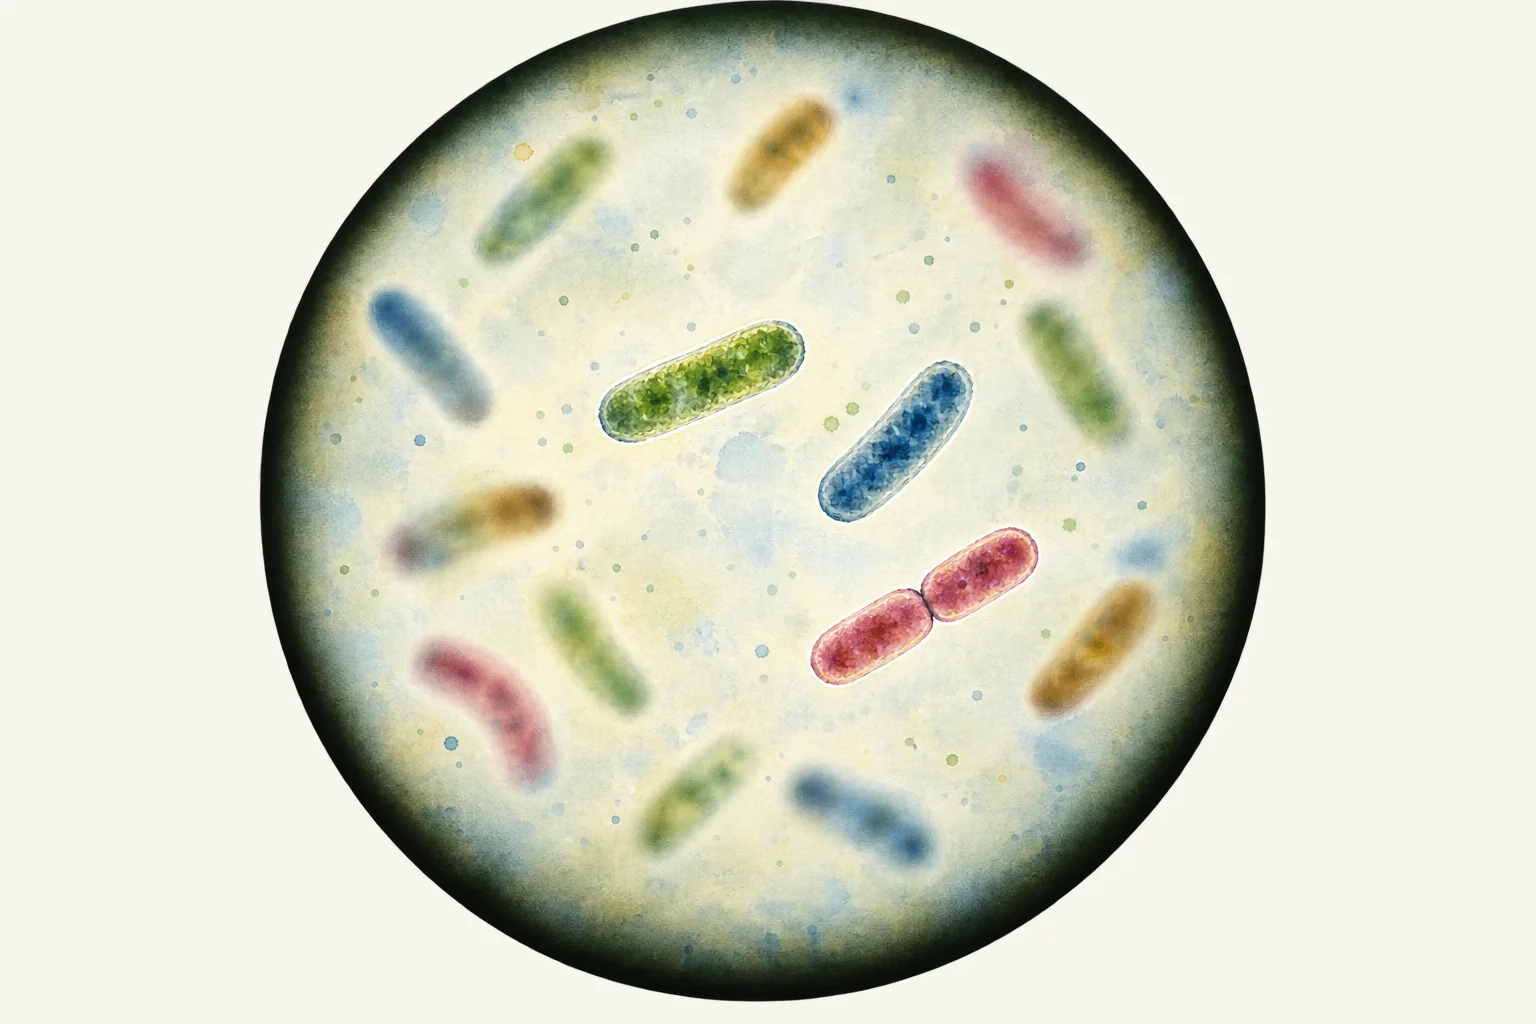 Illustration
Rod-shaped bacteria drifting at different depths of focus, a few sharp and the rest blurred; no particular species is shown.
Illustration: Ants, Cells & Atoms. Generated schematic illustration — not a photograph, micrograph or specimen record. © Ants, Cells & Atoms, all rights reserved.
In the stomach and upper gut, bacteria number 103–104 per millilitre. Between them, the two hold fewer bacteria than a single millilitre of the colon's contents, which run near 1011 per millilitre. Every organ outside the colon together adds at most about 1012, under 4% of the colon's share.
Slide the diagram sideways to read its labels, or open it full size.
Bacteria by organ (upper bounds) and human cells by type on one log axis; the colon's bacteria, each 1–2 µm across [10−6 m], and the red blood cells lead by a factor of ten or more.
Data: how-many-bacteria-in-the-human-body-bacteria-by-organ.csv (sources, version and license, JSON) and human-cell-counts.csv (sources, version and license, JSON).
"Bacteria by organ and human cells by type, log scale" by Ants, Cells & Atoms, https://antscellsandatoms.com/scale/how-many-bacteria-in-the-human-body/ — CC BY 4.0 (https://creativecommons.org/licenses/by/4.0/)
Data sources for this figure
Data: Sender R, Fuchs S, Milo R 2016, PLoS Biology 14(8):e1002533, CC BY 4.0, https://doi.org/10.1371/journal.pbio.1002533 (Table 1 organ bounds; Box 4 and Fig 2 cell counts); Bianconi E et al. 2013, Annals of Human Biology 40(6):463-471 (bibliographic record; figures as summarised in Sender 2016), https://doi.org/10.3109/03014460.2013.807878; Azevedo FAC et al. 2009, Journal of Comparative Neurology 513(5):532-541 (abstract), https://doi.org/10.1002/cne.21974; chart drawn for this page 2026-10-24
Data: Sender R, Fuchs S, Milo R 2016, PLoS Biology 14(8):e1002533, CC BY 4.0, https://doi.org/10.1371/journal.pbio.1002533 (Table 1; retrieved 2026-10-24)
Data sources for this figure
Data: Sender R, Fuchs S, Milo R 2016, PLoS Biology 14(8):e1002533, CC BY 4.0, https://doi.org/10.1371/journal.pbio.1002533 (Box 4 and Fig 2; retrieved 2026-10-24); Bianconi E et al. 2013, Annals of Human Biology 40(6):463-471 (bibliographic record; figures as summarised in Sender 2016), https://doi.org/10.3109/03014460.2013.807878; Azevedo FAC et al. 2009, Journal of Comparative Neurology 513(5):532-541 (abstract), https://doi.org/10.1002/cne.21974; platelet, bone-marrow and other-type counts computed 2026-10-24 for this page from the shares Sender 2016 carried over from Bianconi 2013
The same lopsided picture appears in a drop of seawater, where plankton counts are dominated by the smallest cells. It is why a log axis is the only honest way to draw the chart above. On an ordinary ruler scaled to 1014, the stomach's 107 would sit a ten-millionth of the way along, pressed against zero.
Where did ten to one come from?
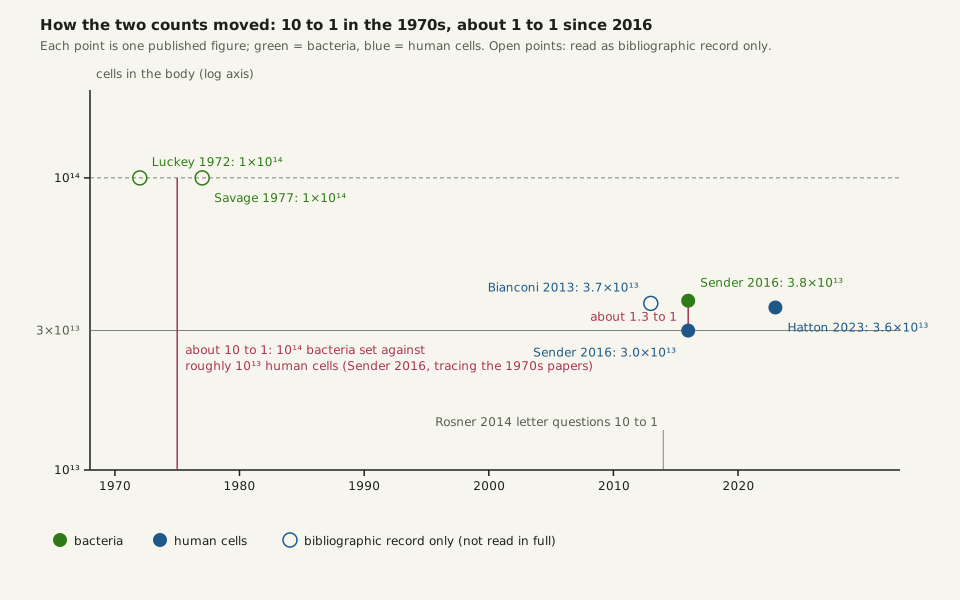
Sender and colleagues traced every paper they could find that gave a source for the number of gut bacteria back to a single sentence. In 1972 Luckey assumed about 1011 bacteria per gram of gut content and multiplied by 1 litre, about 1 kg, of alimentary tract. That gave 1014.
This page has the 1972 paper only as a bibliographic record. The derivation above is as Sender and colleagues describe it. Savage's 1977 review repeated the 1014 figure (bibliographic record); set against a human count of roughly 1013, it gave the ten-to-one ratio that Sender and colleagues date to the 1970s.
A common headline version of the claim says the body is 10 times more bacterial than human, or carries 1–3 kg of bacteria. For the 1–3% body-mass version, Sender and colleagues cite a 2012 news release from the US National Institutes of Health (bibliographic record only). By their account, a 2014 letter in Microbe by Rosner questioned the ratio, and in 2016 the recount followed, first as a letter in Cell and then as the full PLoS Biology paper; the Cell letter is a bibliographic record here.
Slide the diagram sideways to read its labels, or open it full size.
Published counts 1972–2023: the 1970s count of 1014 bacteria, cells 1–2 µm across [10−6 m], came down by a factor of about 2.6, and the human count settled at 3.0–3.7×10¹³.
Open points were read only as bibliographic records. Data: how-many-bacteria-in-the-human-body-estimates-timeline.csv (sources, version and license, JSON).
"Published counts of bacteria and human cells, 1972 to 2023" by Ants, Cells & Atoms, https://antscellsandatoms.com/scale/how-many-bacteria-in-the-human-body/ — CC BY 4.0 (https://creativecommons.org/licenses/by/4.0/)
Data sources for this figure
Data: Luckey TD 1972, The American Journal of Clinical Nutrition 25(12):1292-1294 (bibliographic record; derivation as traced in Sender 2016), https://doi.org/10.1093/ajcn/25.12.1292; Savage DC 1977, Annual Review of Microbiology 31:107-133 (bibliographic record; as cited in Sender 2016), https://doi.org/10.1146/annurev.mi.31.100177.000543; Bianconi E et al. 2013, Annals of Human Biology 40(6):463-471 (bibliographic record; figures as summarised in Sender 2016), https://doi.org/10.3109/03014460.2013.807878; Rosner JL 2014, Microbe 9:47 (bibliographic record, as cited in Sender 2016); Sender R, Fuchs S, Milo R 2016, Cell 164(3):337-340 (bibliographic record), https://doi.org/10.1016/j.cell.2016.01.013; Sender R, Fuchs S, Milo R 2016, PLoS Biology 14(8):e1002533, CC BY 4.0, https://doi.org/10.1371/journal.pbio.1002533; Hatton IA et al. 2023, Proceedings of the National Academy of Sciences 120(39):e2303077120, CC BY 4.0, https://doi.org/10.1073/pnas.2303077120; timeline drawn for this page 2026-10-24
Data sources for this figure
Data: Luckey TD 1972, The American Journal of Clinical Nutrition 25(12):1292-1294 (bibliographic record; derivation as traced in Sender 2016), https://doi.org/10.1093/ajcn/25.12.1292; Savage DC 1977, Annual Review of Microbiology 31:107-133 (bibliographic record; as cited in Sender 2016), https://doi.org/10.1146/annurev.mi.31.100177.000543; Bianconi E et al. 2013, Annals of Human Biology 40(6):463-471 (bibliographic record; figures as summarised in Sender 2016), https://doi.org/10.3109/03014460.2013.807878; Rosner JL 2014, Microbe 9:47 (bibliographic record, as cited in Sender 2016); Sender R, Fuchs S, Milo R 2016, Cell 164(3):337-340 (bibliographic record), https://doi.org/10.1016/j.cell.2016.01.013; Sender R, Fuchs S, Milo R 2016, PLoS Biology 14(8):e1002533, CC BY 4.0, https://doi.org/10.1371/journal.pbio.1002533 (retrieved 2026-10-24); Hatton IA et al. 2023, Proceedings of the National Academy of Sciences 120(39):e2303077120, CC BY 4.0, https://doi.org/10.1073/pnas.2303077120 (retrieved 2026-10-24)
What changed was not the density but the volume. The 1011 bacteria per gram of the 1972 sentence has held up well. The recount removed the assumption that a whole litre of gut content carries that density, when only the colon does.
Route one: counting the colon
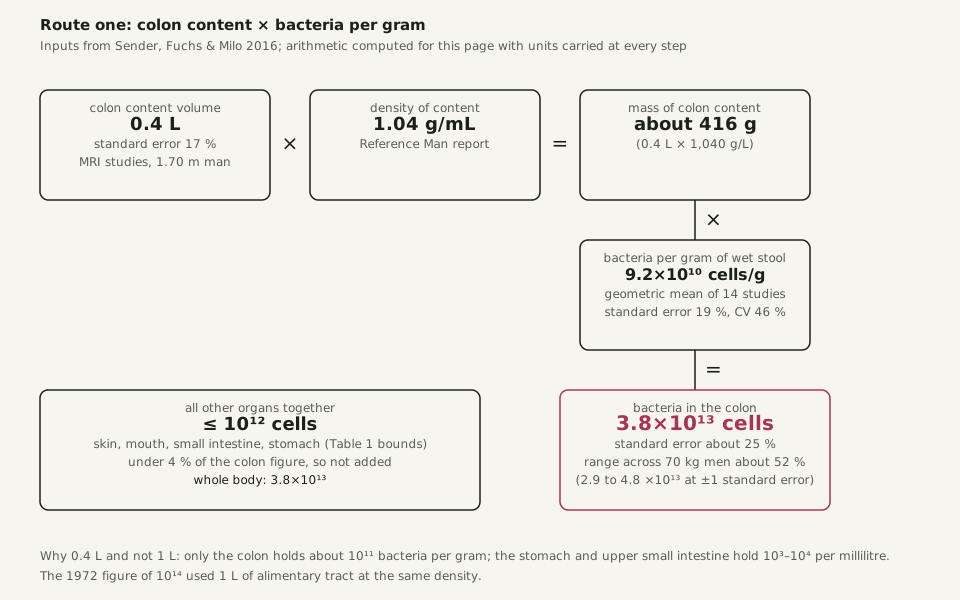
The recount multiplies three numbers, and each carries a unit. The volume of colon content comes from imaging studies of the undisturbed colon, normalised to a 1.70 m man. It is about 0.4 L, with a standard error of 17% and a spread of 25% between men. The reference-man tables put its density at 1.04 g/mL, so the colon holds about 416 g of content.
For bacterial density, the recount turns to stool. The figure is the geometric mean of 14 stool studies from 1966 to 2008, converted to a common wet-weight basis. It is 9.2×10¹⁰ cells per gram, with a standard error of 19% and a spread of 46% between people.
Multiplied through with units carried, 416 g × 9.2×1010 cells/g gives 3.8×10¹³ cells, computed for this page and matching Sender and colleagues' figure. Combining the two standard errors in quadrature gives about 25%, so one standard error spans 2.9×10¹³ to 4.8×10¹³. The same unit discipline that keeps a water strider estimate honest applies here: a litre has to become grams before it can meet cells per gram.
Slide the diagram sideways to read its labels, or open it full size.
Route one: colon content 0.4 L, density 1.04 g/mL, 9.2×10¹⁰ bacteria per gram, product 3.8×10¹³ bacteria at about 1–2 µm each [10−6 m].
Inputs from Sender, Fuchs and Milo 2016; arithmetic computed for this page. Data: how-many-bacteria-in-the-human-body-bacteria-count-inputs.csv (sources, version and license, JSON).
"Route one: counting the colon" by Ants, Cells & Atoms, https://antscellsandatoms.com/scale/how-many-bacteria-in-the-human-body/ — CC BY 4.0 (https://creativecommons.org/licenses/by/4.0/)
Data: Sender R, Fuchs S, Milo R 2016, PLoS Biology 14(8):e1002533, CC BY 4.0, https://doi.org/10.1371/journal.pbio.1002533 (Box 1 colon volume, Table 1 density and organ bounds, Box 2 and Table 2 bacteria per gram); computed for this page 2026-10-24 from the inputs listed above, with units carried at every step
Data sources for this figure
Data: Sender R, Fuchs S, Milo R 2016, PLoS Biology 14(8):e1002533, CC BY 4.0, https://doi.org/10.1371/journal.pbio.1002533 (retrieved 2026-10-24); Rose C, Parker A, Jefferson B, Cartmell E 2015, Critical Reviews in Environmental Science and Technology 45(17):1827-1879, CC BY 3.0, https://doi.org/10.1080/10643389.2014.1000761 (retrieved 2026-10-24); Hatton IA et al. 2023, Proceedings of the National Academy of Sciences 120(39):e2303077120, CC BY 4.0, https://doi.org/10.1073/pnas.2303077120 (retrieved 2026-10-24); Stephen AM, Cummings JH 1980, Journal of Medical Microbiology 13(1):45-56 (bibliographic record; fraction as relayed by Rose 2015 and Sender 2016), https://doi.org/10.1099/00222615-13-1-45; Bianconi E et al. 2013, Annals of Human Biology 40(6):463-471 (bibliographic record; figures as summarised in Sender 2016), https://doi.org/10.3109/03014460.2013.807878; results computed 2026-10-24 for this page with units carried at every step
The weakest input is colon volume. The imaging studies behind 0.4 L were few; one reported a volume that included an unmeasured amount of gas, and the most detailed had to estimate the stool fraction, about 70%, to remove it. Sender and colleagues also note that using stool density for the whole colon is probably an upper limit. Bacterial concentration climbs from about 108 per gram where the small intestine empties into the colon to about 1011 per gram at the exit.
Route two: the same count another way
A second route should not reuse the colon volume or the bacteria-per-gram figure. So this one starts from what leaves the body. A review of 60 studies of healthy adults puts the median dry mass of stool at 29 g per day; study means ranged from 12 to 81 g. The same review puts bacterial biomass, living and dead, at 25–54% of those dry solids (Rose and colleagues 2015).
Among the sources they cite for that fraction is Stephen and Cummings 1980, a bibliographic record here. An average gut bacterium has a dry mass of about 1–2 pg (Sender and colleagues 2016). Sender and colleagues quote colonic transit, the time content spends in the colon, at a normal 25–40 hours.
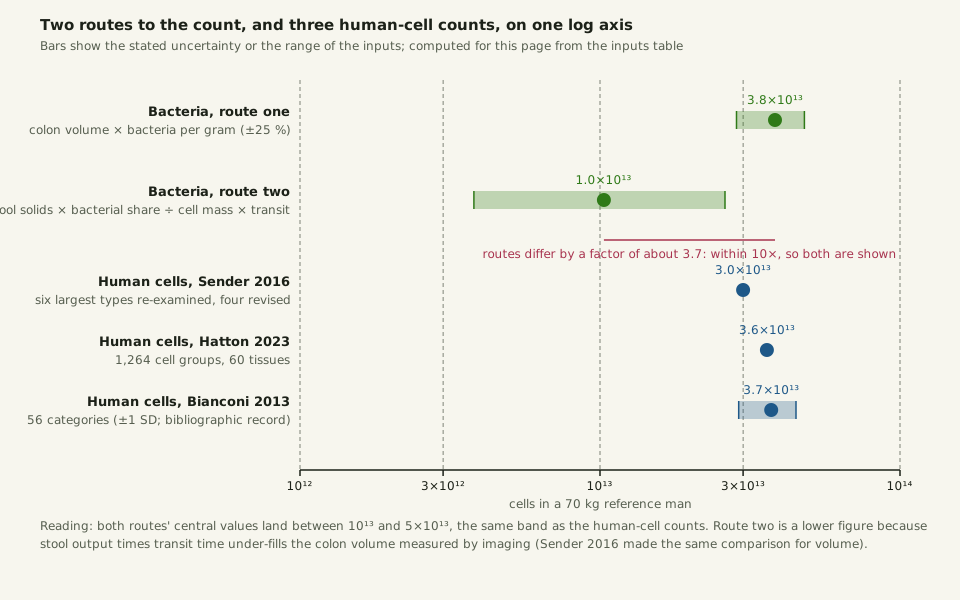
Computed for this page: 29 g/day × 0.40 ÷ 1.5 pg per cell gives about 7.7×10¹² bacteria leaving per day. A residence time of 32.5 hours turns that flow into a standing population of about 1.0×10¹³. Holding stool output at the 29 g median and pushing the other three inputs to their favourable ends gives 2.6×10¹³; pushing them the other way gives 3.8×10¹².
At 3.8×10¹³, route one is about 3.7 times the central value of route two, within the factor of ten this site requires before it publishes an estimate.
Slide the diagram sideways to read its labels, or open it full size.
Two routes to the count of gut bacteria 1–2 µm across [10−6 m] and three published human-cell counts on one log axis; every central value lands between 1013 and 5×10¹³.
Bars show stated uncertainty or input ranges. Computed for this page from the inputs table. Data: how-many-bacteria-in-the-human-body-bacteria-count-inputs.csv (sources, version and license, JSON).
"Two routes to the bacterial count, next to three human cell counts" by Ants, Cells & Atoms, https://antscellsandatoms.com/scale/how-many-bacteria-in-the-human-body/ — CC BY 4.0 (https://creativecommons.org/licenses/by/4.0/)
Data sources for this figure
Data: Sender R, Fuchs S, Milo R 2016, PLoS Biology 14(8):e1002533, CC BY 4.0, https://doi.org/10.1371/journal.pbio.1002533; Rose C, Parker A, Jefferson B, Cartmell E 2015, Critical Reviews in Environmental Science and Technology 45(17):1827-1879, CC BY 3.0, https://doi.org/10.1080/10643389.2014.1000761 (median dry stool solids 29 g per day; bacterial biomass 25-54 % of dry solids); Stephen AM, Cummings JH 1980, Journal of Medical Microbiology 13(1):45-56 (bibliographic record; fraction as relayed by Rose 2015 and Sender 2016), https://doi.org/10.1099/00222615-13-1-45; Hatton IA et al. 2023, Proceedings of the National Academy of Sciences 120(39):e2303077120, CC BY 4.0, https://doi.org/10.1073/pnas.2303077120; Bianconi E et al. 2013, Annals of Human Biology 40(6):463-471 (bibliographic record; figures as summarised in Sender 2016), https://doi.org/10.3109/03014460.2013.807878; computed for this page 2026-10-24 from the inputs listed above, with units carried at every step
Data sources for this figure
Data: Sender R, Fuchs S, Milo R 2016, PLoS Biology 14(8):e1002533, CC BY 4.0, https://doi.org/10.1371/journal.pbio.1002533 (retrieved 2026-10-24); Rose C, Parker A, Jefferson B, Cartmell E 2015, Critical Reviews in Environmental Science and Technology 45(17):1827-1879, CC BY 3.0, https://doi.org/10.1080/10643389.2014.1000761 (retrieved 2026-10-24); Hatton IA et al. 2023, Proceedings of the National Academy of Sciences 120(39):e2303077120, CC BY 4.0, https://doi.org/10.1073/pnas.2303077120 (retrieved 2026-10-24); Stephen AM, Cummings JH 1980, Journal of Medical Microbiology 13(1):45-56 (bibliographic record; fraction as relayed by Rose 2015 and Sender 2016), https://doi.org/10.1099/00222615-13-1-45; Bianconi E et al. 2013, Annals of Human Biology 40(6):463-471 (bibliographic record; figures as summarised in Sender 2016), https://doi.org/10.3109/03014460.2013.807878; results computed 2026-10-24 for this page with units carried at every step
Route two comes in lower mostly because stool output times transit time under-fills the colon. At 29 g of dry solids a day for about 1.4 days, the colon would hold about 40 g of solids. Yet 416 g of content at 27% dry matter, the figure Sender and colleagues use, is about 110 g of dry solids. They met the same gap when they checked the colon volume against stool flow and got 150–250 mL instead of 400 mL.
Both routes support one conclusion: a body holds on the order of 1013 bacteria, somewhere between 1 and 4×10¹³. The "about half" of the title rests on the better-documented colon route.
Why most of your cells are red blood cells
The human count has its own two routes. By Sender and colleagues' account, Bianconi and colleagues summed 56 categories of cell in 2013 and reached 3.7×10¹³ with a standard deviation of 0.8×10¹³; the 2013 paper is a bibliographic record here. Sender and colleagues re-examined the six largest categories, revised four of them, and reached 3.0×10¹³. In 2023 Ian Hatton and colleagues rebuilt the count from 1,264 cell groups across 60 tissues.
They reported about 36 trillion cells in a 70 kg male, about 28 trillion in a 60 kg female and about 17 trillion in a 32 kg ten-year-old. The three compilations agree to within about a quarter.
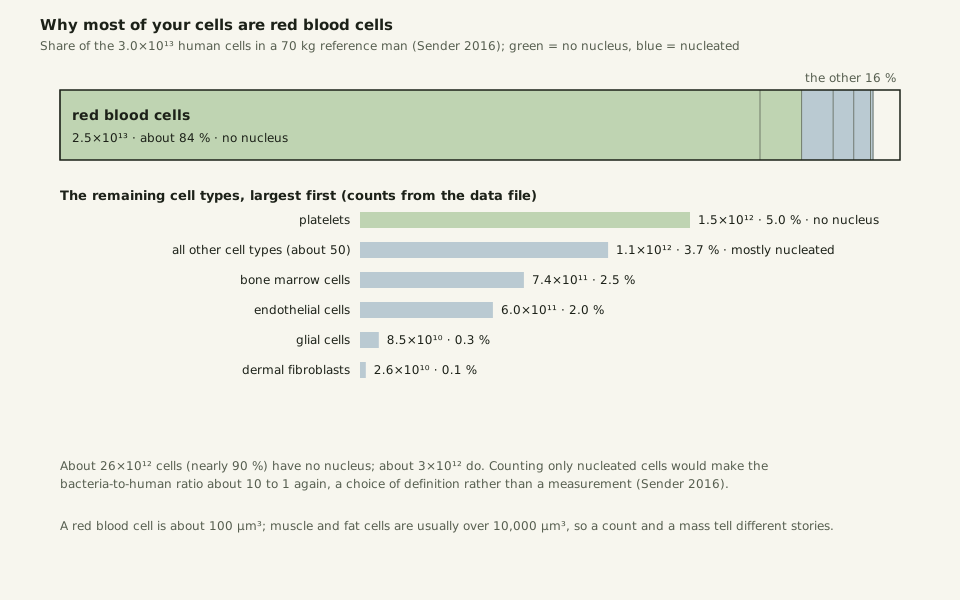
In all three, red blood cells dominate. Blood volume of 4.9 L times a red cell count of 5.0×10¹² per litre gives 2.5×10¹³ red blood cells, computed for this page; Sender and colleagues put red blood cells at 84% of their total. That red cell count is the one on a blood test, where the normal range for men is 4.6–6.1×10¹² per litre.
Red blood cells and platelets carry no nucleus, so nearly 90% of your cells, about 26×1012, have none. That matters for the length of DNA per cell: most cells have no DNA to measure. Only about 3×10¹² human cells are nucleated.
Slide the diagram sideways to read its labels, or open it full size.
Human cells by type for a 70 kg man: red blood cells 2.5×10¹³ of 3.0×10¹³; a red blood cell is about 100 µm3 [10−6 m].
Green: no nucleus; blue: nucleated. Data: human-cell-counts.csv (sources, version and license, JSON).
"Human cells by type: red blood cells are about 84 percent of the count" by Ants, Cells & Atoms, https://antscellsandatoms.com/scale/how-many-bacteria-in-the-human-body/ — CC BY 4.0 (https://creativecommons.org/licenses/by/4.0/)
Data sources for this figure
Data: Sender R, Fuchs S, Milo R 2016, PLoS Biology 14(8):e1002533, CC BY 4.0, https://doi.org/10.1371/journal.pbio.1002533 (Box 4, Fig 2 and Fig 3); Bianconi E et al. 2013, Annals of Human Biology 40(6):463-471 (bibliographic record; figures as summarised in Sender 2016), https://doi.org/10.3109/03014460.2013.807878; Azevedo FAC et al. 2009, Journal of Comparative Neurology 513(5):532-541 (abstract), https://doi.org/10.1002/cne.21974; chart drawn for this page 2026-10-24
Data sources for this figure
Data: Sender R, Fuchs S, Milo R 2016, PLoS Biology 14(8):e1002533, CC BY 4.0, https://doi.org/10.1371/journal.pbio.1002533 (Box 4 and Fig 2; retrieved 2026-10-24); Bianconi E et al. 2013, Annals of Human Biology 40(6):463-471 (bibliographic record; figures as summarised in Sender 2016), https://doi.org/10.3109/03014460.2013.807878; Azevedo FAC et al. 2009, Journal of Comparative Neurology 513(5):532-541 (abstract), https://doi.org/10.1002/cne.21974; platelet, bone-marrow and other-type counts computed 2026-10-24 for this page from the shares Sender 2016 carried over from Bianconi 2013
Two revisions in the Sender count show how a convention can inflate a number. Glial cells were long put at ten times the number of neurons, about 3×10¹². A 2009 count found about 86 billion neurons and about 85 billion non-neuronal cells in the adult male brain (Azevedo and colleagues 2009, abstract). That ratio is near 1 to 1, so the glial figure fell to 8.5×10¹⁰.
Dermal fibroblasts fell from 1.85×10¹² to 2.6×10¹⁰, a factor of about 70, once the thickness of the dermis entered the calculation. Compare the bacteria to nucleated cells only and the ratio returns to about 10 to 1. As Sender and colleagues point out, that is a matter of definition rather than measurement.
How much do all those bacteria weigh?
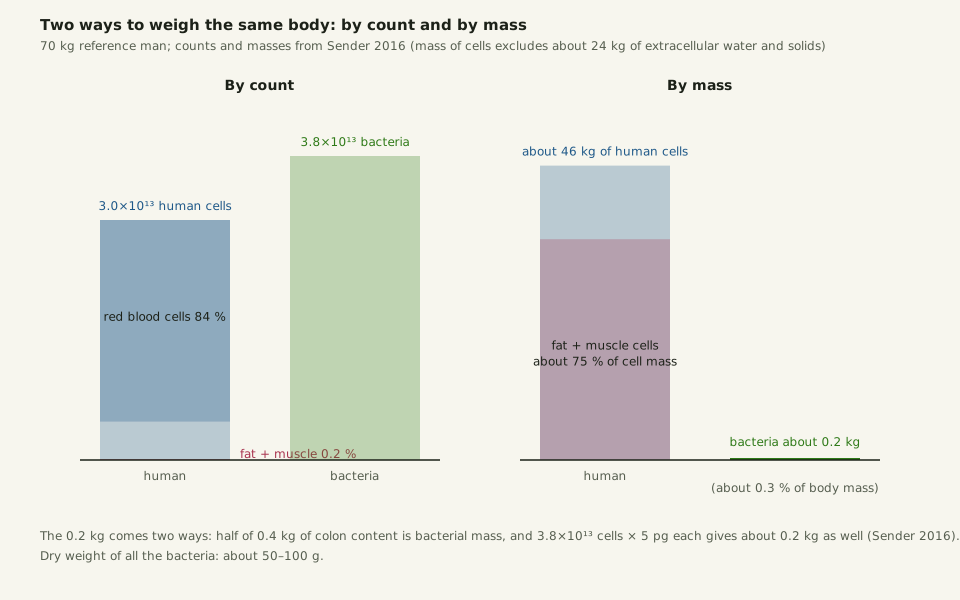
About 0.2 kg, wet. Half of the 0.4 kg of colon content is bacterial mass, by the fraction Sender and colleagues take from Stephen and Cummings 1980 and a 1984 study of bacterial dry matter. The same 0.2 kg comes back from the other side: 3.8×10¹³ cells at about 5 pg each. That wet 0.2 kg is about 0.3% of a 70 kg body, against the 1–3 kg of the headline claim. Dry, the body's bacteria amount to about 50–100 g.
Set the two scales side by side and the body looks different on each. By count, bacteria slightly outnumber human cells. By mass, human cells total about 46 kg once the 24 kg or so of extracellular water and solids are removed. Three quarters of that mass sits in fat and muscle cells. Those cells are usually over 10,000 µm3 apiece and make up about 0.2% of the count.
A red blood cell, at about 100 µm3, is among the smallest cells in the body. A full table of cell sizes is the job of How Big Is a Cell. Here the point is that a count and a mass of the same body answer different questions.
Slide the diagram sideways to read its labels, or open it full size.
Count against mass for a 70 kg man: 3.8×10¹³ bacteria of about 1–2 µm weigh about 0.2 kg; 3.0×10¹³ human cells weigh about 46 kg [10−6 m].
Data: how-many-bacteria-in-the-human-body-mass-vs-count.csv (sources, version and license, JSON).
"Count against mass: 3.8e13 bacteria weigh about 0.2 kg" by Ants, Cells & Atoms, https://antscellsandatoms.com/scale/how-many-bacteria-in-the-human-body/ — CC BY 4.0 (https://creativecommons.org/licenses/by/4.0/)
Data: Sender R, Fuchs S, Milo R 2016, PLoS Biology 14(8):e1002533, CC BY 4.0, https://doi.org/10.1371/journal.pbio.1002533 (Fig 3 and the mass section); chart drawn for this page 2026-10-24
Data: Sender R, Fuchs S, Milo R 2016, PLoS Biology 14(8):e1002533, CC BY 4.0, https://doi.org/10.1371/journal.pbio.1002533 (retrieved 2026-10-24); fat and muscle count and mass derived 2026-10-24 for this page from the shares given in Sender 2016
How big is one gut bacterium?
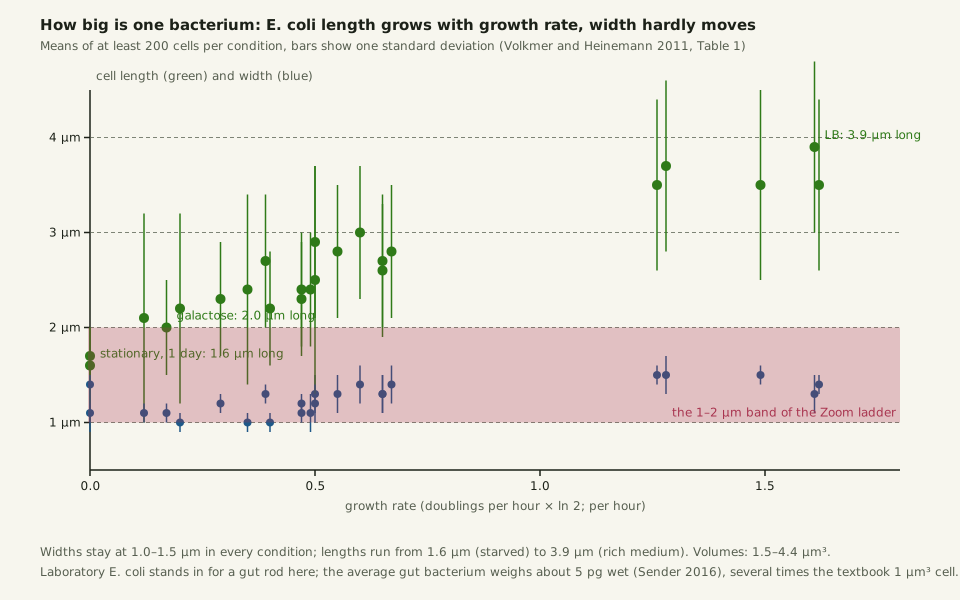
The average gut bacterium behind these figures weighs about 5 pg wet. It is several times heavier than the 1 pg, 1 µm3 bacterium of textbook estimates. In culture, Escherichia coli cells measured 1.0–1.5 µm wide and 1.6–3.9 µm long, shortest when starved and longest when growing fast on rich medium (Volkmer and Heinemann 2011, 22 growth conditions).
A cell of that size swimming in water at 20 °C at about 30 µm/s sits far below the syrup line, where viscosity wins over inertia. It is also the size of the 1 µm bead that never sits still in Brownian motion. A baker's yeast cell is a few times larger; diatoms, glass-walled cells mostly 20–200 µm, sit one to two rungs further up the ladder.
Slide the diagram sideways to read its labels, or open it full size.
E. coli length and width across 22 growth conditions: length 1.6–3.9 µm, width 1.0–1.5 µm, so one cell is 1–2 µm across [10−6 m].
Means of at least 200 cells per condition, bars one standard deviation. Data: how-many-bacteria-in-the-human-body-ecoli-sizes.csv (sources, version and license, JSON).
"E. coli cell length and width against growth rate" by Ants, Cells & Atoms, https://antscellsandatoms.com/scale/how-many-bacteria-in-the-human-body/ — CC BY 4.0 (https://creativecommons.org/licenses/by/4.0/)
Data: Volkmer B, Heinemann M 2011, PLoS ONE 6(7):e23126, CC BY 4.0, https://doi.org/10.1371/journal.pone.0023126 (Table 1; retrieved 2026-10-24); figure drawn for this page 2026-10-24
Data: Volkmer B, Heinemann M 2011, PLoS ONE 6(7):e23126, CC BY 4.0, https://doi.org/10.1371/journal.pone.0023126 (Table 1; retrieved 2026-10-24)
Every bacterial figure on this page leans on one unmeasured thing: the density of bacteria along the colon itself, rather than in the stool that leaves it. Concentration rises a thousandfold from the start of the colon to the exit, through water absorption, growth during the 25–40 hour transit and shedding from the gut wall. As of the 2016 recount, that gradient had not been measured in a living person well enough to replace the stool proxy. Until someone does, the count sits at about 3.8×10¹³, give or take a quarter, with a second, cruder route pointing lower.
Sources
- Sender R, Fuchs S, Milo R. "Revised Estimates for the Number of Human and Bacteria Cells in the Body." PLoS Biology 14(8):e1002533 (2016). https://doi.org/10.1371/journal.pbio.1002533 Read: full text. Text license: CC BY 4.0 (https://creativecommons.org/licenses/by/4.0/).
- Hatton IA, Galbraith ED, Merleau NSC, Miettinen TP, Smith BM, Shander JA. "The human cell count and size distribution." Proceedings of the National Academy of Sciences 120(39):e2303077120 (2023). https://doi.org/10.1073/pnas.2303077120 Read: full text. Text license: CC BY 4.0 (https://creativecommons.org/licenses/by/4.0/).
- Rose C, Parker A, Jefferson B, Cartmell E. "The Characterization of Feces and Urine: A Review of the Literature to Inform Advanced Treatment Technology." Critical Reviews in Environmental Science and Technology 45(17):1827–1879 (2015). https://doi.org/10.1080/10643389.2014.1000761 Read: full text. Text license: CC BY 3.0 (https://creativecommons.org/licenses/by/3.0/).
- Volkmer B, Heinemann M. "Condition-Dependent Cell Volume and Concentration of Escherichia coli to Facilitate Data Conversion for Systems Biology Modeling." PLoS ONE 6(7):e23126 (2011). https://doi.org/10.1371/journal.pone.0023126 Read: full text. Text license: CC BY 4.0 (https://creativecommons.org/licenses/by/4.0/).
- Bianconi E, Piovesan A, Facchin F, Beraudi A, Casadei R, Frabetti F, et al. "An estimation of the number of cells in the human body." Annals of Human Biology 40(6):463–471 (2013). https://doi.org/10.3109/03014460.2013.807878 Read: bibliographic record only.
- Luckey TD. "Introduction to intestinal microecology." The American Journal of Clinical Nutrition 25(12):1292–1294 (1972). https://doi.org/10.1093/ajcn/25.12.1292 Read: bibliographic record only.
- Savage DC. "Microbial ecology of the gastrointestinal tract." Annual Review of Microbiology 31:107–133 (1977). https://doi.org/10.1146/annurev.mi.31.100177.000543 Read: bibliographic record only.
- Stephen AM, Cummings JH. "The microbial contribution to human faecal mass." Journal of Medical Microbiology 13(1):45–56 (1980). https://doi.org/10.1099/00222615-13-1-45 Read: bibliographic record only.
- Sender R, Fuchs S, Milo R. "Are We Really Vastly Outnumbered? Revisiting the Ratio of Bacterial to Host Cells in Humans." Cell 164(3):337–340 (2016). https://doi.org/10.1016/j.cell.2016.01.013 Read: bibliographic record only.
- Cummings JH, Bingham SA, Heaton KW, Eastwood MA. "Fecal weight, colon cancer risk, and dietary intake of nonstarch polysaccharides (dietary fiber)." Gastroenterology 103(6):1783–1789 (1992). https://doi.org/10.1016/0016-5085(92)91435-7 Read: bibliographic record only.
- Azevedo FAC, Carvalho LRB, Grinberg LT, Farfel JM, Ferretti REL, Leite REP, et al. "Equal numbers of neuronal and nonneuronal cells make the human brain an isometrically scaled-up primate brain." Journal of Comparative Neurology 513(5):532–541 (2009). https://doi.org/10.1002/cne.21974 Read: abstract.
- National Institutes of Health. "NIH Human Microbiome Project defines normal bacterial makeup of the body." News release, 2012. https://www.nih.gov/news-events/news-releases/nih-human-microbiome-project-defines-normal-bacterial-makeup-body Read: bibliographic record only.
Cite this page
Ants, Cells & Atoms. “How Many Cells in the Human Body? About Half Are Bacteria.” Published 2026-10-25. https://antscellsandatoms.com/scale/how-many-bacteria-in-the-human-body/. Accessed (add the date you read it).
No DOI is issued for entries. Figures made here are CC BY 4.0; see each caption for the license of photographs.
Related entries
Reynolds Number: Why a Bacterium Can't Coast and a Fish Can
Image: “Oczlik (Cyclops) - samica” by Mikron86 (2025) · CC BY 4.0
"Oczlik (Cyclops) - samica" by Mikron86 — https://commons.wikimedia.org/wiki/File:Oczlik_(Cyclops)_-_samica.jpg — CC BY 4.0 (https://creativecommons.org/licenses/by/4.0/)

How Big Is a Cell? Most Are a Hair's Width or Far Narrower
Image: “SEM blood cells” by Bruce Wetzel and Harry Schaefer, National Cancer Institute (1982) · Public domain
"SEM blood cells" by Bruce Wetzel and Harry Schaefer, National Cancer Institute (1982) — https://commons.wikimedia.org/wiki/File:SEM_blood_cells.jpg — Public domain (work of United States federal employees at the National Cancer Institute (NIH), public domain in the United States under 17 U.S.C. §105; Commons tag PD-USGov; the NCI Visuals Online source states that all images are in the public domain and may be reproduced without permission, with credit to the listed source or author; dated February 1982; used in the EU on the source's explicit public-domain statement)

 Illustration
How Small Is an Atom? For Most Elements, About 0.1–0.5 nm
Image: Illustration: Ants, Cells & Atoms, all rights reserved
Illustration: Ants, Cells & Atoms. Generated schematic illustration — not a photograph, micrograph or specimen record. © Ants, Cells & Atoms, all rights reserved.