Borrowed Color: When a Micrograph's Hue Isn't the Cell's Own

Slide the ladder sideways to read its labels, or open it full size.
A stained cell under a light microscope: Paramecium entries of 91–251 µm [10−5–10−4 m], with this page's other examples from 1.6 to 138 µm long.
Log scale from 10 cm to 0.1 nm, each rung ten times smaller; dashed lines: naked eye about 0.1 mm, light microscope about 0.2 µm (How to read the Zoom ladder). Each band names the kind of color its picture shows. Data: borrowed-color-example-sizes.csv (sources, version and license, JSON).
"Zoom ladder: borrowed color" by Ants, Cells & Atoms, https://antscellsandatoms.com/microscopic-life/borrowed-color/ — CC BY 4.0 (https://creativecommons.org/licenses/by/4.0/)
Data sources for this figure
Data: Lisicki M, Velho Rodrigues MF, Goldstein RE, Lauga E 2019, eLife 8:e44907, CC BY 4.0, https://doi.org/10.7554/eLife.44907 (Appendix 2, typical sizes of ten Paramecium entries), retrieved 2026-10-24; Volkmer B, Heinemann M 2011, PLoS ONE 6(7):e23126, CC BY 4.0, https://doi.org/10.1371/journal.pone.0023126 (Table 1, Escherichia coli length and width), retrieved 2026-10-24; Gastineau R et al. 2021, Biology 10(4):328, CC BY 4.0, https://doi.org/10.3390/biology10040328 (Haslea silbo length), retrieved 2026-10-24; Paulson JR, Hudson DF, Cisneros-Soberanis F, Earnshaw WC 2021, Seminars in Cell and Developmental Biology 117:7-29, CC BY 4.0, https://doi.org/10.1016/j.semcdb.2021.03.014 (largest human mitotic chromosome), retrieved 2026-10-24; CODATA 2022 recommended values, NIST, https://physics.nist.gov/cuu/Constants/ (Planck constant, elementary charge, electron mass, speed of light); electron wavelengths computed 2026-10-24
Data sources for this figure
Data: Lisicki M, Velho Rodrigues MF, Goldstein RE, Lauga E 2019, eLife 8:e44907, CC BY 4.0, https://doi.org/10.7554/eLife.44907 (Appendix 2, typical sizes of ten Paramecium entries), retrieved 2026-10-24; Volkmer B, Heinemann M 2011, PLoS ONE 6(7):e23126, CC BY 4.0, https://doi.org/10.1371/journal.pone.0023126 (Table 1, Escherichia coli length and width), retrieved 2026-10-24; Gastineau R et al. 2021, Biology 10(4):328, CC BY 4.0, https://doi.org/10.3390/biology10040328 (Haslea silbo length), retrieved 2026-10-24; Paulson JR, Hudson DF, Cisneros-Soberanis F, Earnshaw WC 2021, Seminars in Cell and Developmental Biology 117:7-29, CC BY 4.0, https://doi.org/10.1016/j.semcdb.2021.03.014 (largest human mitotic chromosome), retrieved 2026-10-24; GBIF Backbone Taxonomy, GBIF Secretariat, CC BY 4.0, https://doi.org/10.15468/39omei (taxon keys for Paramecium, Escherichia coli and Haslea), retrieved 2026-10-24
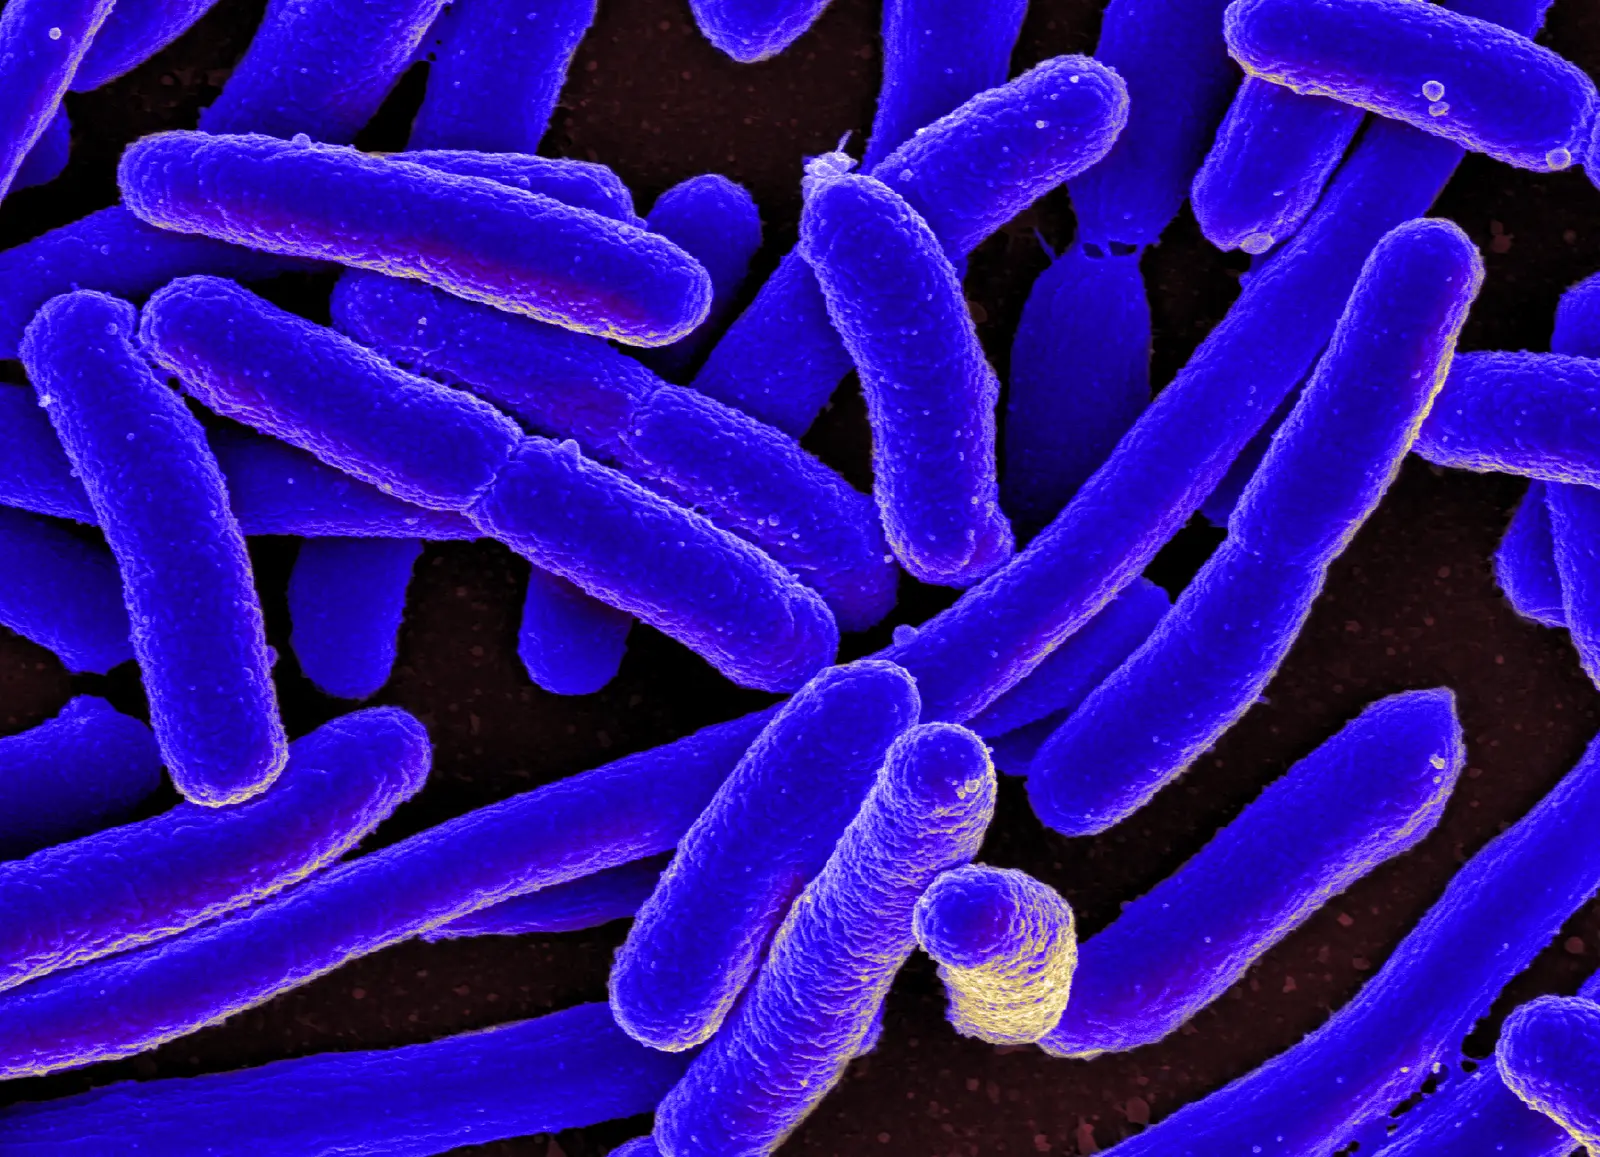
Escherichia coli grown in culture, colorized scanning electron micrograph; in one 2011 study, cells of this species grown in 22 conditions averaged 1.6–3.9 µm long and 1.0–1.5 µm wide [10−6 m].
Color: false color
"E. coli Bacteria (16578744517)" by NIAID — https://commons.wikimedia.org/wiki/File:E._coli_Bacteria_(16578744517).jpg — CC BY 2.0 (https://creativecommons.org/licenses/by/2.0/)

The violet in that picture was added after the micrograph was made. NIAID, which published it, describes it as a "Colorized scanning electron micrograph of Escherichia coli, grown in culture and adhered to a cover slip." Every photograph and micrograph caption on this site carries a Color: line naming one of four sources: native, stain, fluorescence or false color. The last three are borrowed; native means nothing was added.
What does a stain add to a cell?
Most cells are transparent, or change the brightness of the light passing through them only a little, which makes them hard to see in plain bright-field microscopy. That is how Rappaz and colleagues put it in a 2014 paper on imaging cells without labels. Transparent cells shift the phase of light more strongly, and phase contrast microscopy, first proposed by Zernike, was developed to see such objects without adding anything to them. A photograph made that way keeps the label native.
A stain takes the other route. It is a dye that colors the cell, or some of its parts more than others, so that they stand out against the bright field. The paramecium below was stained with opal blue (Opalblau), according to the photographer's description, and the dye colored both the cell and the threads around it. The same description notes that the threads are trichocysts, not cilia.
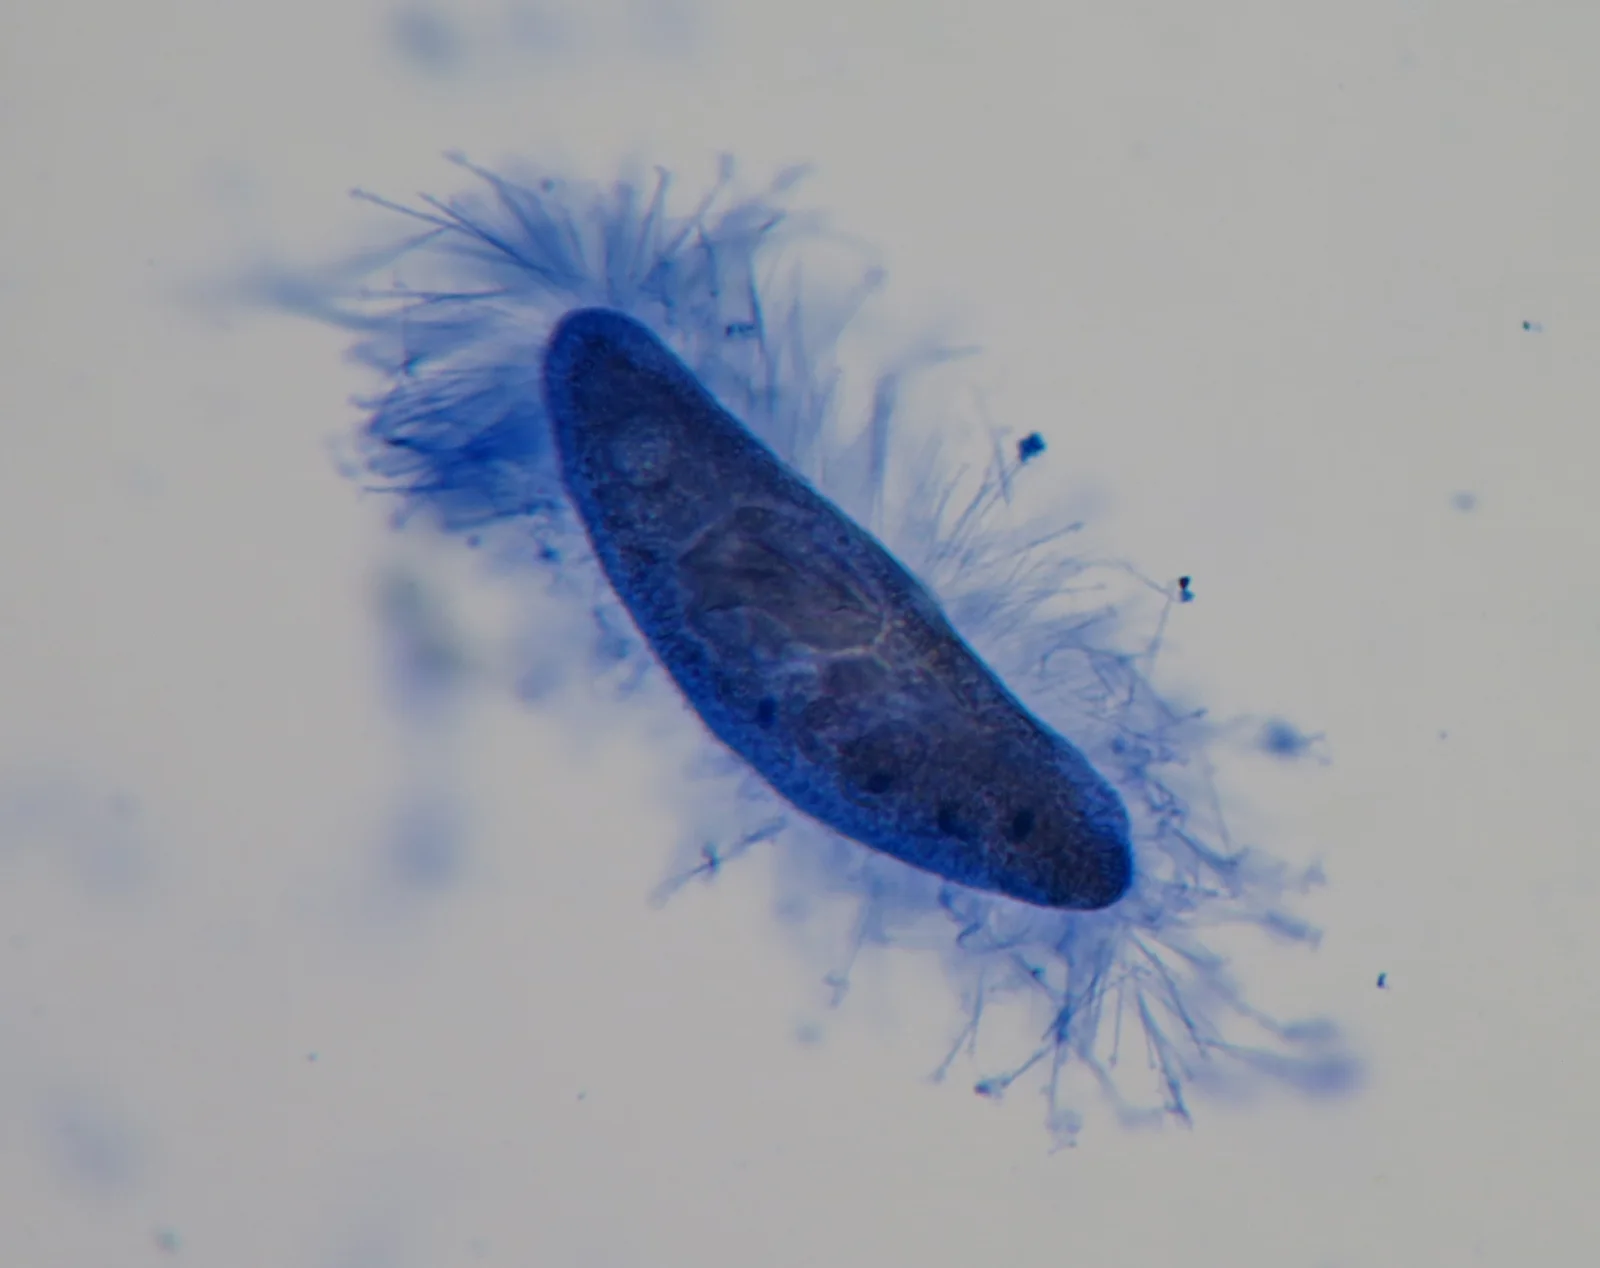
A Paramecium stained with opal blue; Paramecium entries in one 2019 compilation have typical sizes of 91–251 µm [10−5–10−4 m].
Color: stain (opal blue)
"Paramecium - Trichocysten - Opalblau (8149944429)" by Picturepest — https://commons.wikimedia.org/wiki/File:Paramecium_-_Trichocysten_-_Opalblau_(8149944429).jpg — CC BY 2.0 (https://creativecommons.org/licenses/by/2.0/)

The photographer also fixed the cell in buffered formalin, the description adds. A living Paramecium caudatum, with a typical size of 225.5 µm in Lisicki and colleagues' 2019 compilation, swims at about 2,489 µm/s; what that speed means in water is worked out under Reynolds Number.
Some stains work as a test. In a 2023 dataset from the Barents Sea, Caridi and colleagues used Rose Bengal and a fluorescent marker called CellTracker Green to tell living foraminifera from dead ones. They sorted the Rose Bengal samples under an ordinary stereomicroscope and the CellTracker Green samples under a fluorescence stereomicroscope.
Chromosomes owe even their name to stains. Walther Flemming, who studied dividing cells in the 1870s, adapted dyes from bacteriology and called the threads and nuclear material chromatin because they took up stain; Waldeyer later named the threads chromosomes, as Paulson and colleagues recount in a 2021 review.
How do fluorescent markers add color?
A fluorescent marker makes its target glow instead. In a fluorescence microscope the specimen is lit with light of a chosen wavelength; the marker molecules absorb it and give off light of a longer wavelength, which is a different color. Fluorescence in situ hybridization, or FISH, uses fluorescent probes that bind to matching stretches of DNA.
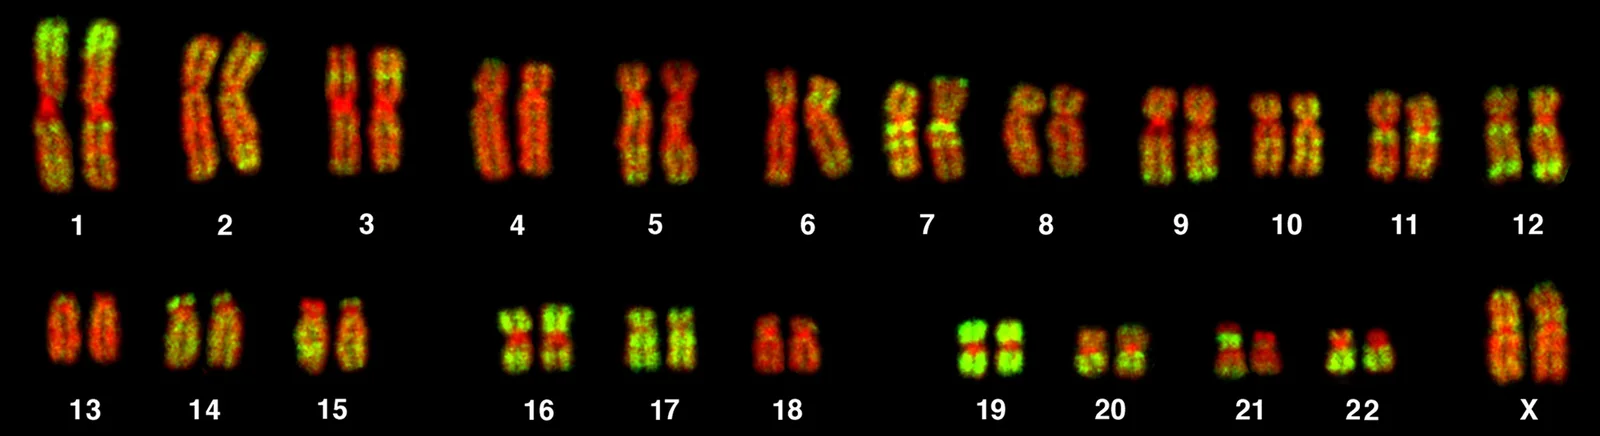
Chromosomes of a female human lymphocyte (46, XX) after FISH; the largest human mitotic (dividing) chromosome is about 8–10 µm long [10−6–10−5 m].
Color: fluorescence (Alu probe, green; TOPRO-3 DNA counterstain, red)
"PLoSBiol3.5.Fig7ChromosomesAluFish" by Bolzer A, Kreth G, Solovei I, Koehler D, Saracoglu K, Fauth C, Müller S, Eils R, Cremer C, Speicher MR, Cremer T — https://commons.wikimedia.org/wiki/File:PLoSBiol3.5.Fig7ChromosomesAluFish.jpg — CC BY 2.5 (https://creativecommons.org/licenses/by/2.5/)

The chromosome set above comes from a 2005 study by Bolzer and colleagues. Its legend says the chromosomes were hybridized with a probe for Alu sequences, shown in green, and counterstained with TOPRO-3, shown in red; the Alu sequences mark chromosome bands rich in genes. By Paulson and colleagues' account, each chromatid, one half of a dividing chromosome, holds a single long DNA double helix. The largest human mitotic chromosome is about 8–10 µm long, and each of its two chromatids holds a DNA molecule 8.5 cm long; between divisions, that molecule fits into a nucleus about 10 µm across.
Even these colors pass through a choice. Another panel of the same figure shows a separate TOPRO-3 image and a separate Alu image merged into one color picture. In the study's 24-color experiments, each dye was recorded as its own stack of 8-bit gray-scale images before the channels were superimposed, and software then allocated a false color to each classified chromosome type. Seven dyes, used in combinations, had to tell 24 chromosome types apart, so the colors on those maps stand for the classification rather than for any one dye.
Some fluorescent dyes need no probe. Pillet and colleagues (2014) stained the chitin in yeast cell walls with calcofluor white, and bud scars about 1 µm across showed up clearly in their fluorescence images of the budding yeast Saccharomyces cerevisiae. The same paper used methylene blue, the dye behind this site's blue, to check whether the cells were alive.
Is the color in an electron micrograph real?
No. A scanning electron microscope (SEM) builds its picture from electrons, not light. As the beam sweeps across the specimen, a detector counts the electrons it receives while the beam rests on each point, and that single value per pixel is shown as a level of grey. Some SEMs also collect the light a specimen gives off under the beam and can show it in real color.
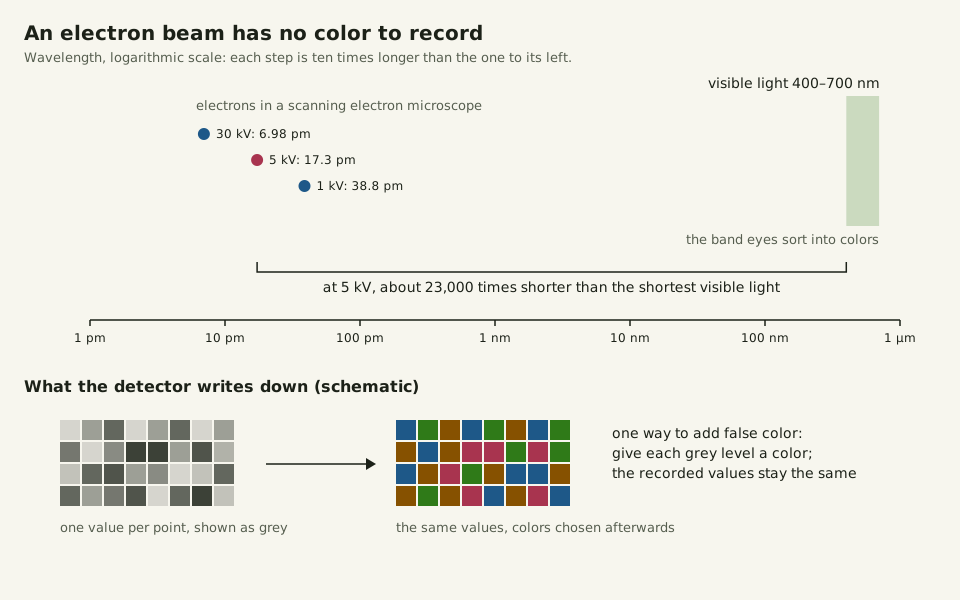
Published SEM images are very often colored afterwards, by hand or with software, for looks or to make structures stand out. The color generally adds no information about the specimen. The simplest method, as Wikipedia's article on the instrument describes it, replaces each grey level with an arbitrary color from a lookup table, which is called false color imaging; the lower panel of the figure below sketches it.
Song and Lee's 2018 review of color vision in insects puts the human visible spectrum at 400–700 nm. An electron beam sits far outside that band. At the 5.0 kV accelerating voltage printed on the grey E. coli micrograph in How Many Cells in the Human Body?, an electron's wavelength is about 17 picometres (pm), computed for this page from CODATA 2022 constants: some 23,000 times shorter than the shortest visible light.
Slide the diagram sideways to read its labels, or open it full size.
Electron wavelengths in a scanning electron microscope against visible light: 6.98–38.8 pm at 30 to 1 kV, versus 400–700 nm [10−12–10−7 m].
Wavelengths computed for this page from CODATA 2022 constants; the lower panel is a schematic. Data: borrowed-color-wavelengths.csv (sources, version and license, JSON).
"Electron wavelengths versus visible light" by Ants, Cells & Atoms, https://antscellsandatoms.com/microscopic-life/borrowed-color/ — CC BY 4.0 (https://creativecommons.org/licenses/by/4.0/)
Data: Song B-M, Lee C-H 2018, Frontiers in Neural Circuits 12:16, CC BY 4.0, https://doi.org/10.3389/fncir.2018.00016 (human visible spectrum 400-700 nm), retrieved 2026-10-24; CODATA 2022 recommended values, NIST, https://physics.nist.gov/cuu/Constants/ (Planck constant, elementary charge, electron mass, speed of light); electron wavelengths computed 2026-10-24
That is why this site labels a grey SEM native: no color was added. The grey E. coli on the cell-count page carries the line native (electron micrograph, no color), and NIAID describes it in almost the same words as the violet one above, without the word colorized. The same holds for an SEM of an insect's compound eye. A scanning tunnelling microscope, which images single atoms, also records one value at each point of its scan, so its pictures are grayscale until color is added in processing.
Which colors are the cell's own?
Native color comes from the organism. The blue diatom Haslea silbo, named as a new species in 2021 and 20.2–138.0 µm long, makes a blue pigment similar to marennine and keeps it in sacs (vacuoles) at the tips of the cell, where it shows blue under a light microscope. Released into the growth medium, the same pigment looks green, and its production seems to be triggered by stronger light, Gastineau and colleagues reported in 2021. In a preliminary characterization, they compared the pigment with marennine by measuring it with UV–visible spectrophotometry and Raman spectrometry.
The pigments of these blue diatoms are water-soluble, blue-green and play no part in photosynthesis. Marennine, from Haslea ostrearia (Vibrio ostrearius in GBIF), turns the gills of oysters green in Western Europe, so the diatom's native color ends up worn by an oyster. Haslea silbo cells also shrank in culture, from 138.0 µm in the largest initial cells to 20.2 µm at the final stage, which is the story told under Diatoms.
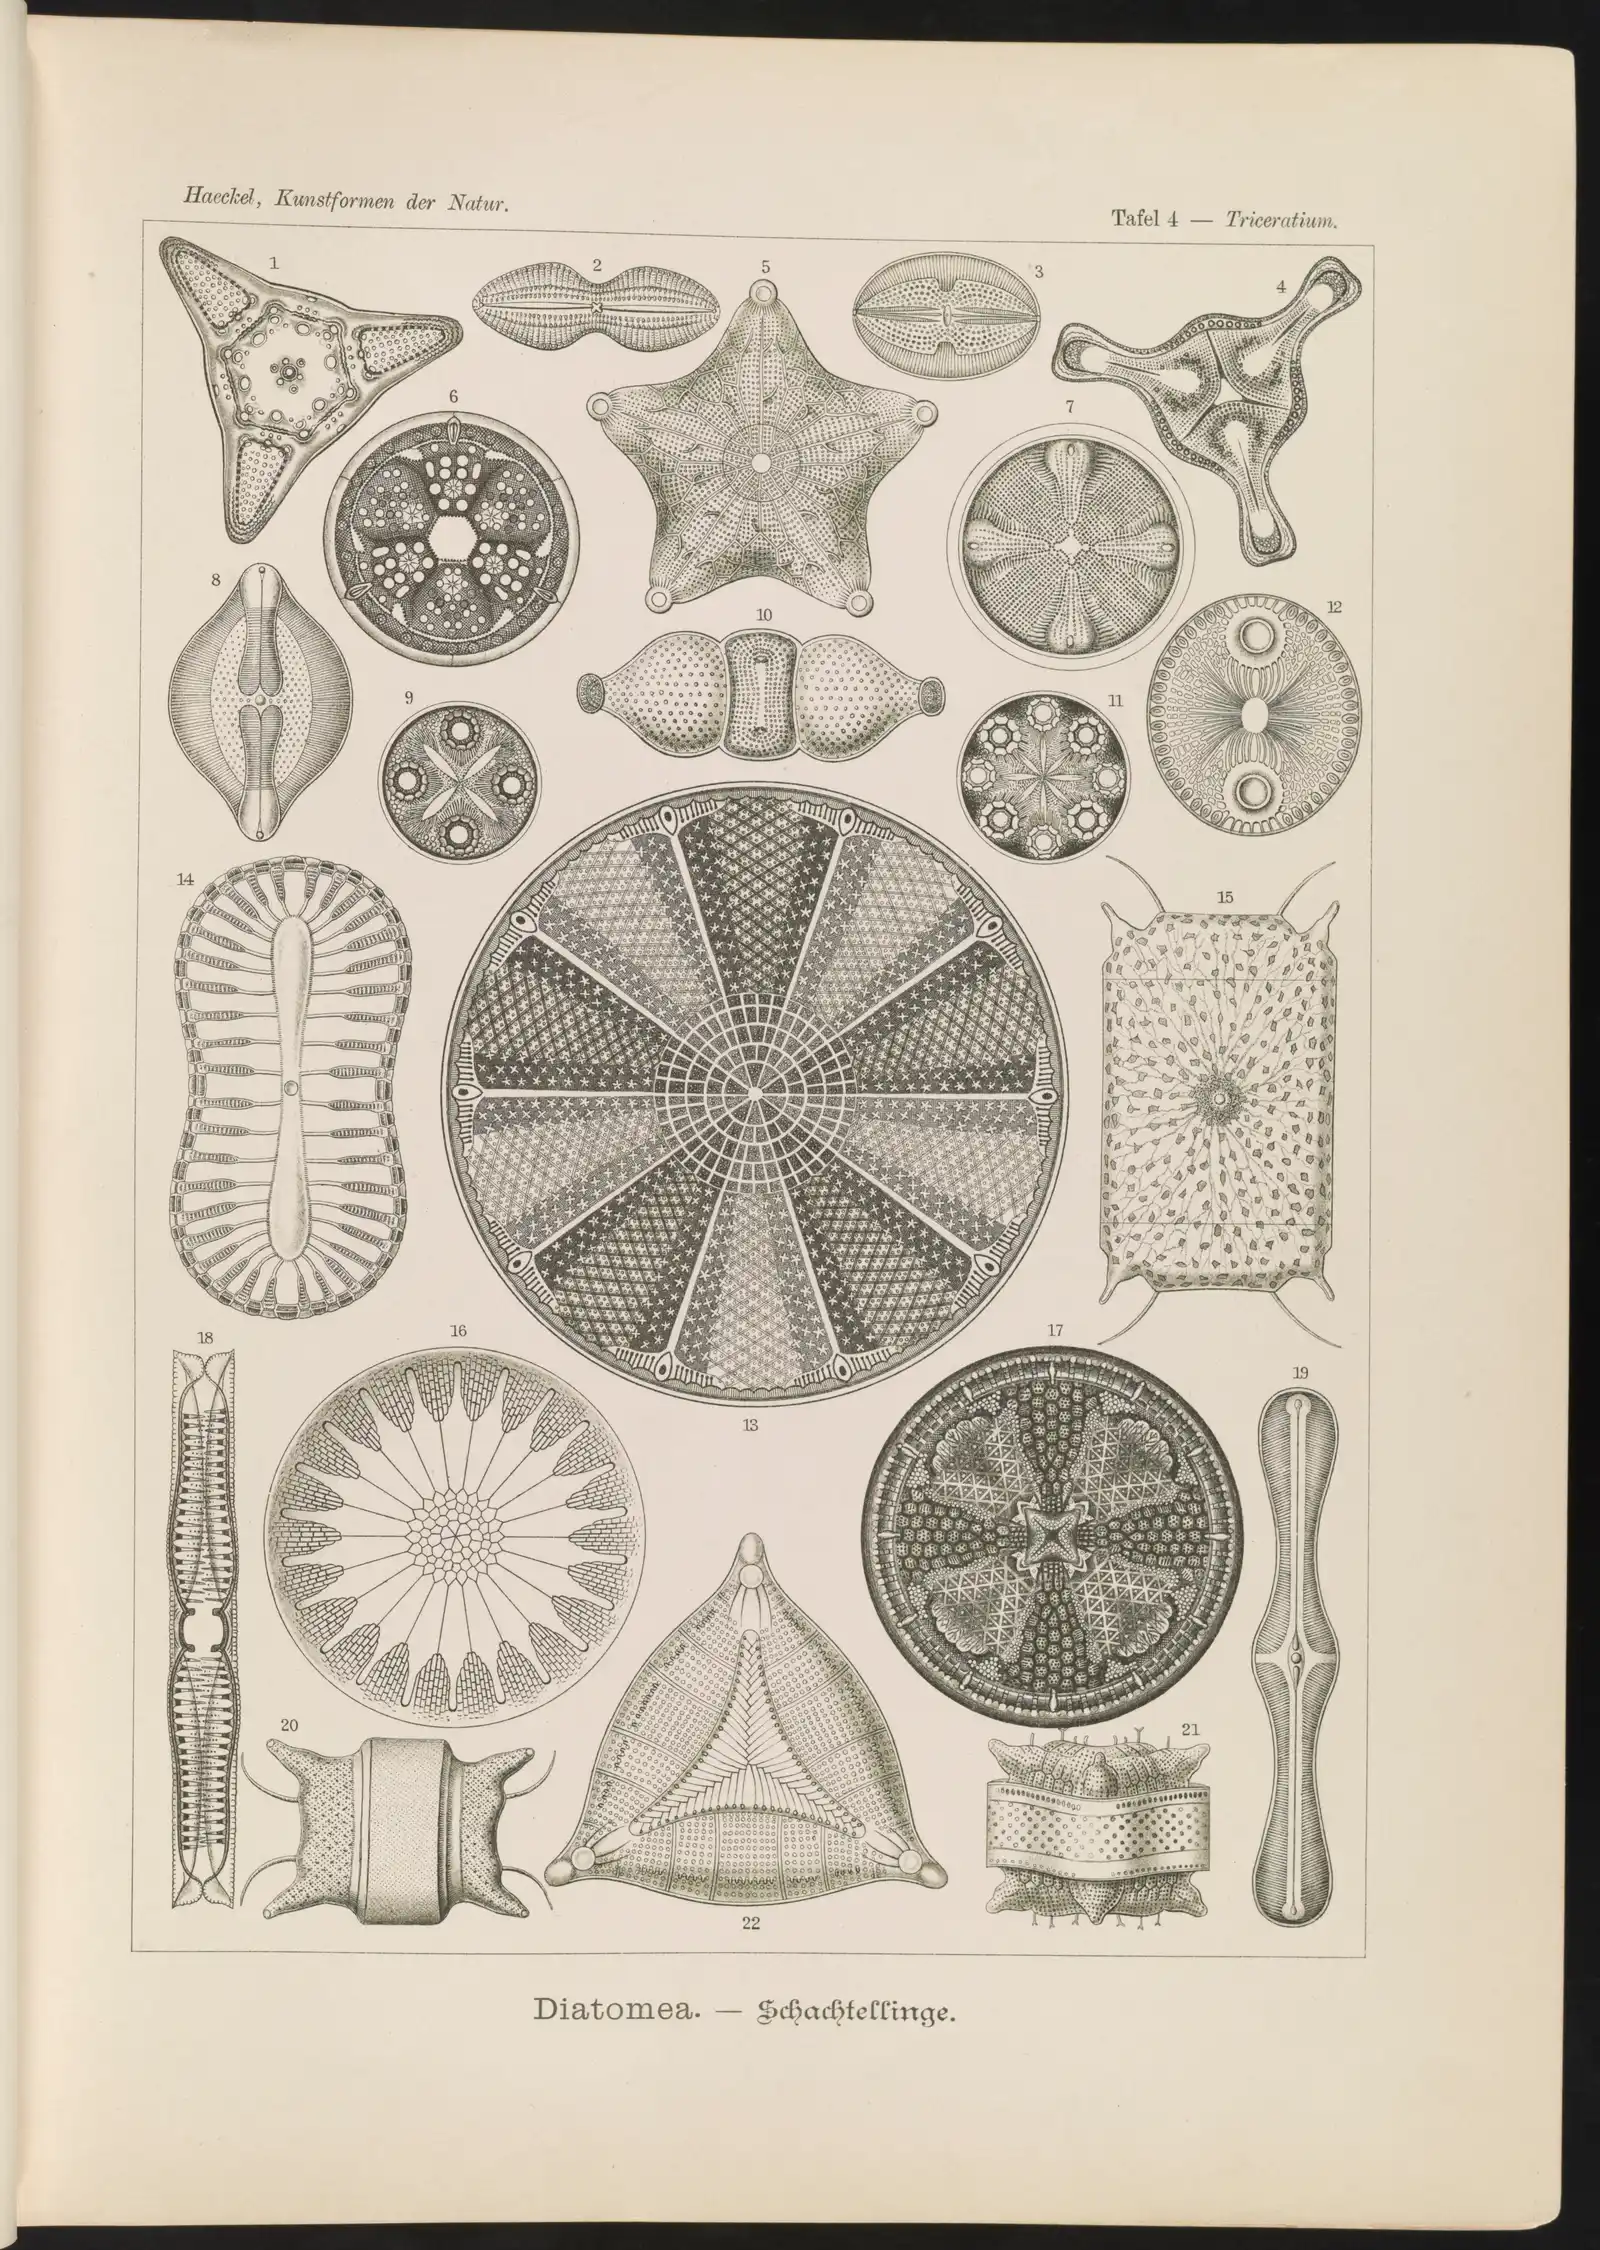
On this site, native also covers pictures with no color to borrow. A grey electron micrograph is native (electron micrograph, no color), and Ernst Haeckel's 1904 lithograph of diatoms on Plankton is native (the plate's single printed ink; a lithograph, not a micrograph). Native says only that no color was added; it does not promise that the picture shows the cell's colors faithfully.
Native pictures have their own uses. For screens that compare cell shapes, Rappaz and colleagues argue for methods without labels, both to avoid changing the cells through the imaging itself and because labels cost money. This site's own palette, by contrast, comes from stains: its blue, rose and amber stand for methylene blue, safranin and Lugol's iodine, set against a chloroplast green.
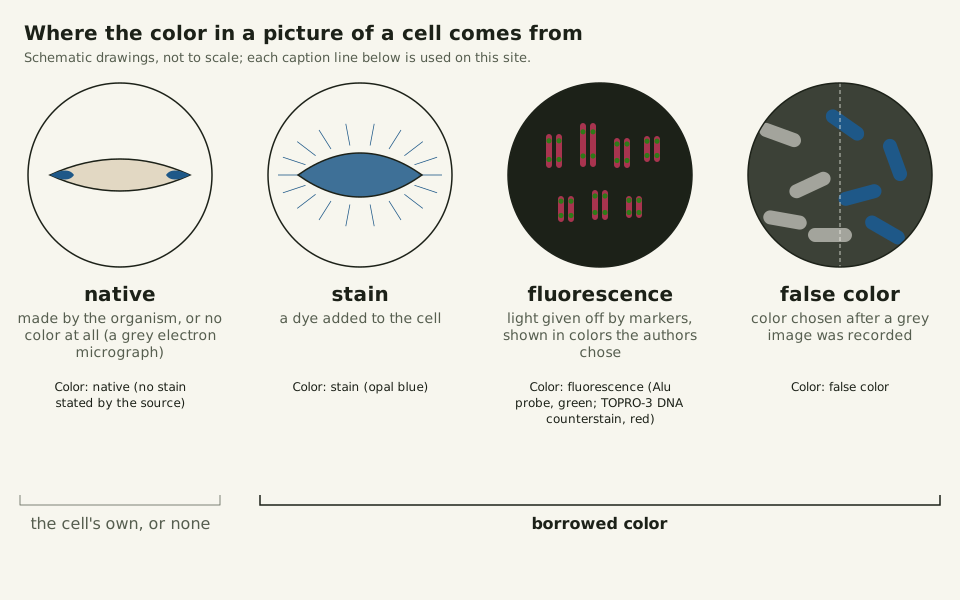
Slide the diagram sideways to read its labels, or open it full size.
The four kinds of color a Color: line can declare, drawn on schematic cells; the examples sized on this page run from 1.0 to 251 µm [10−6–10−4 m].
Native is the cell's own color or no color at all; the other three are borrowed. Data: borrowed-color-color-lines.csv (sources, version and license, JSON).
"Four kinds of color in a picture of a cell" by Ants, Cells & Atoms, https://antscellsandatoms.com/microscopic-life/borrowed-color/ — CC BY 4.0 (https://creativecommons.org/licenses/by/4.0/)
Data: File description pages on Wikimedia Commons for the photographs named in the CSV (descriptions only), retrieved 2026-10-24; Bolzer A et al. 2005, PLoS Biology 3(5):e157, CC BY, https://doi.org/10.1371/journal.pbio.0030157 (Figure 7A legend), retrieved 2026-10-24
| Color line | What made the color | Example on this site |
|---|---|---|
| native (electron micrograph, no color) | nothing: one grey value per point | E. coli, scanning electron micrograph ([[42-0005 |
| native (no stain stated by the source) | the animal itself, as far as the source records | Diacyclops thomasi, a copepod ([[42-0002 |
| native (the plate's single printed ink; a lithograph, not a micrograph) | printing ink on a lithograph | Haeckel's diatom plate, 1904 ([[42-0002 |
| stain (opal blue) | a dye the source names | a Paramecium, this page |
| stain (magenta, not named by the photographer) | a dye the source does not name | Ceratium, a dinoflagellate ([[42-0002 |
| fluorescence (Alu probe, green; TOPRO-3 DNA counterstain, red) | light given off by markers, shown in chosen colors | human chromosomes, this page |
| false color | color added to a grey image after imaging | E. coli, this page |
How is a Color: line decided?
Every Color: line on this site follows six questions, in order, about the source's description and the picture itself. You can ask them of any micrograph. The list below spells them out.
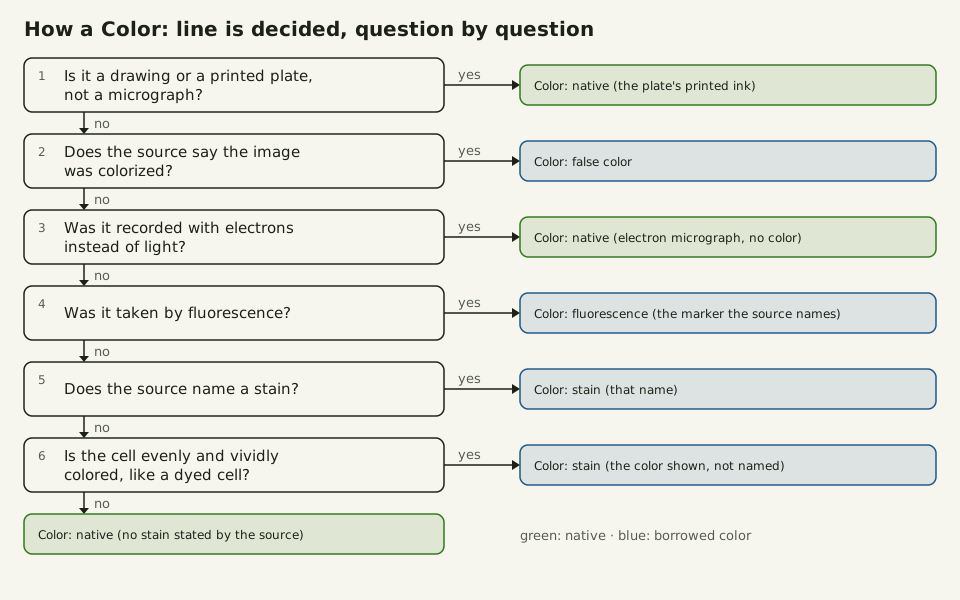
Slide the diagram sideways to read its labels, or open it full size.
How a Color: line is decided, one question at a time, for pictures of cells such as the examples sized on this page, 1.0–251 µm [10−6–10−4 m].
Green outcomes are native, blue ones are borrowed color; each outcome is a caption line used on this site.
"How a Color: line is decided" by Ants, Cells & Atoms, https://antscellsandatoms.com/microscopic-life/borrowed-color/ — CC BY 4.0 (https://creativecommons.org/licenses/by/4.0/)
Data: Outcomes are the caption lines in borrowed-color-color-lines.csv, computed 2026-10-24
- 1. A drawing or printed plate, not a micrograph: native, with a note on the ink.
- 2. The source calls the image colorized: false color.
- 3. Recorded with electrons and not colorized: native (electron micrograph, no color).
- 4. Taken by fluorescence: fluorescence, with the marker the source names.
- 5. The source names a stain: stain, with that name.
- 6. The cell looks evenly and vividly dyed, though the source names no dye: stain, with the color it shows, not named by the photographer. Anything else: native (no stain stated by the source).
Only step 6 rests on the picture alone. The dinoflagellate on Plankton reached it: its photographer named no dye, but its cell contents are an even magenta, so its line reads stain (magenta, not named by the photographer). The source neither confirms nor rules out a stain, so the line reports what the picture shows.
A Color: line can only be as specific as the record behind the picture. When a photographer never says how a picture was made, native (no stain stated by the source) describes the paperwork, and the cell's own color under that microscope stays unmeasured.
Sources
- Lisicki M, Velho Rodrigues MF, Goldstein RE, Lauga E. "Swimming eukaryotic microorganisms exhibit a universal speed distribution." eLife 8:e44907 (2019). https://doi.org/10.7554/eLife.44907 Read: full text. Text license: CC BY 4.0 (https://creativecommons.org/licenses/by/4.0/).
- Volkmer B, Heinemann M. "Condition-Dependent Cell Volume and Concentration of Escherichia coli to Facilitate Data Conversion for Systems Biology Modeling." PLoS ONE 6(7):e23126 (2011). https://doi.org/10.1371/journal.pone.0023126 Read: full text. Text license: CC BY 4.0 (https://creativecommons.org/licenses/by/4.0/).
- Rappaz B, Breton B, Shaffer E, Turcatti G. "Digital Holographic Microscopy: A Quantitative Label-Free Microscopy Technique for Phenotypic Screening." Combinatorial Chemistry & High Throughput Screening 17(1):80–88 (2014). https://doi.org/10.2174/13862073113166660062 Read: full text. Text license: CC BY 2.5 (https://creativecommons.org/licenses/by/2.5/).
- Caridi F, Sabbatini A, Morigi C. "Monothalamous soft-shelled foraminiferal image dataset from the Kveithola Trough (NW Barents Sea)." Data in Brief 50:109603 (2023). https://doi.org/10.1016/j.dib.2023.109603 Read: full text. Text license: CC BY 4.0 (https://creativecommons.org/licenses/by/4.0/).
- Paulson JR, Hudson DF, Cisneros-Soberanis F, Earnshaw WC. "Mitotic chromosomes." Seminars in Cell & Developmental Biology 117:7–29 (2021). https://doi.org/10.1016/j.semcdb.2021.03.014 Read: full text. Text license: CC BY 4.0 (https://creativecommons.org/licenses/by/4.0/).
- Wikipedia contributors. "Fluorescence microscope." Wikipedia (read 2026-10-24). https://en.wikipedia.org/wiki/Fluorescence_microscope Read: full text; paraphrased only. Text license: CC BY-SA 4.0 (https://creativecommons.org/licenses/by-sa/4.0/).
- Wikipedia contributors. "Fluorescence in situ hybridization." Wikipedia (read 2026-10-24). https://en.wikipedia.org/wiki/Fluorescence_in_situ_hybridization Read: full text; paraphrased only. Text license: CC BY-SA 4.0 (https://creativecommons.org/licenses/by-sa/4.0/).
- Bolzer A, Kreth G, Solovei I, Koehler D, Saracoglu K, Fauth C, Müller S, Eils R, Cremer C, Speicher MR, Cremer T. "Three-Dimensional Maps of All Chromosomes in Human Male Fibroblast Nuclei and Prometaphase Rosettes." PLoS Biology 3(5):e157 (2005). https://doi.org/10.1371/journal.pbio.0030157 Read: full text. Text license: CC BY 4.0 (https://creativecommons.org/licenses/by/4.0/).
- Pillet F, Lemonier S, Schiavone M, Formosa C, Martin-Yken H, Francois JM, Dague E. "Uncovering by Atomic Force Microscopy of an original circular structure at the yeast cell surface in response to heat shock." BMC Biology 12:6 (2014). https://doi.org/10.1186/1741-7007-12-6 Read: full text. Text license: CC BY 2.0 (https://creativecommons.org/licenses/by/2.0/).
- Wikipedia contributors. "Scanning electron microscope." Wikipedia (read 2026-10-24). https://en.wikipedia.org/wiki/Scanning_electron_microscope Read: full text; paraphrased only. Text license: CC BY-SA 4.0 (https://creativecommons.org/licenses/by-sa/4.0/).
- Song B-M, Lee C-H. "Toward a Mechanistic Understanding of Color Vision in Insects." Frontiers in Neural Circuits 12:16 (2018). https://doi.org/10.3389/fncir.2018.00016 Read: full text. Text license: CC BY 4.0 (https://creativecommons.org/licenses/by/4.0/).
- CODATA 2022 recommended values, NIST Standard Reference Database 121. "Planck constant", "elementary charge", "electron mass", "speed of light in vacuum". https://physics.nist.gov/cuu/Constants/ Read: dataset record.
- Wikipedia contributors. "Scanning tunneling microscope." Wikipedia (read 2026-10-24). https://en.wikipedia.org/wiki/Scanning_tunneling_microscope Read: full text; paraphrased only. Text license: CC BY-SA 4.0 (https://creativecommons.org/licenses/by-sa/4.0/).
- Gastineau R, Hansen G, Poulin M, Lemieux C, Turmel M, Bardeau J-F, Leignel V, Hardivillier Y, Morançais M, Fleurence J, Gaudin P, Méléder V, Cox EJ, Davidovich NA, Davidovich OI, Witkowski A, Kaczmarska I, Ehrman JM, Soler Onís E, Quintana AM, Mucko M, Mordret S, Sarno D, Jacquette B, Falaise C, Séveno J, Lindquist NL, Kemp PS, Eker-Develi E, Konucu M, Mouget J-L. "Haslea silbo, A Novel Cosmopolitan Species of Blue Diatoms." Biology 10(4):328 (2021). https://doi.org/10.3390/biology10040328 Read: full text. Text license: CC BY 4.0 (https://creativecommons.org/licenses/by/4.0/).
- GBIF Secretariat. GBIF Backbone Taxonomy. Checklist dataset https://doi.org/10.15468/39omei, accessed 2026-10-24; Haslea ostrearia (Gaillon) Simonsen, 1974, key 7996358, is filed as a synonym of Vibrio ostrearius Gaillon, 1820, key 7697647; taxon keys for the other organisms named on this page are listed in borrowed-color-example-sizes.csv. Read: dataset record (species match and species records for the taxa named). Text license: CC BY 4.0 (https://creativecommons.org/licenses/by/4.0/).
Cite this page
Ants, Cells & Atoms. “Borrowed Color: When a Micrograph's Hue Isn't the Cell's Own.” Published 2026-10-25. https://antscellsandatoms.com/microscopic-life/borrowed-color/. Accessed (add the date you read it).
No DOI is issued for entries. Figures made here are CC BY 4.0; see each caption for the license of photographs.
Related entries
 Illustration
Diatoms: Why Most Glass-Walled Algae Shrink as They Multiply
Image: Illustration: Ants, Cells & Atoms, all rights reserved
Illustration: Ants, Cells & Atoms. Generated schematic illustration — not a photograph, micrograph or specimen record. © Ants, Cells & Atoms, all rights reserved.
Plankton: From Bacteria to Jellyfish, Sorted in Size Steps
Image: “Diatomea. - Schachtellinge” by Ernst Haeckel (artist) and Adolf Giltsch (lithographer) (1904) · Public domain
"Diatomea. - Schachtellinge" by Ernst Haeckel (artist) and Adolf Giltsch (lithographer) (1904) — https://commons.wikimedia.org/wiki/File:Diatomea._-_Schachtellinge_LCCN2015647735.jpg — Public domain (artist Ernst Haeckel died 1919 and lithographer Adolf Giltsch died 1911, so the plate is out of copyright in the EU (life plus 70 years) and in the US (published 1904, before 1930); the scan is from the Library of Congress Prints and Photographs division (lccn.loc.gov/2015647735), which lists no rights restriction)

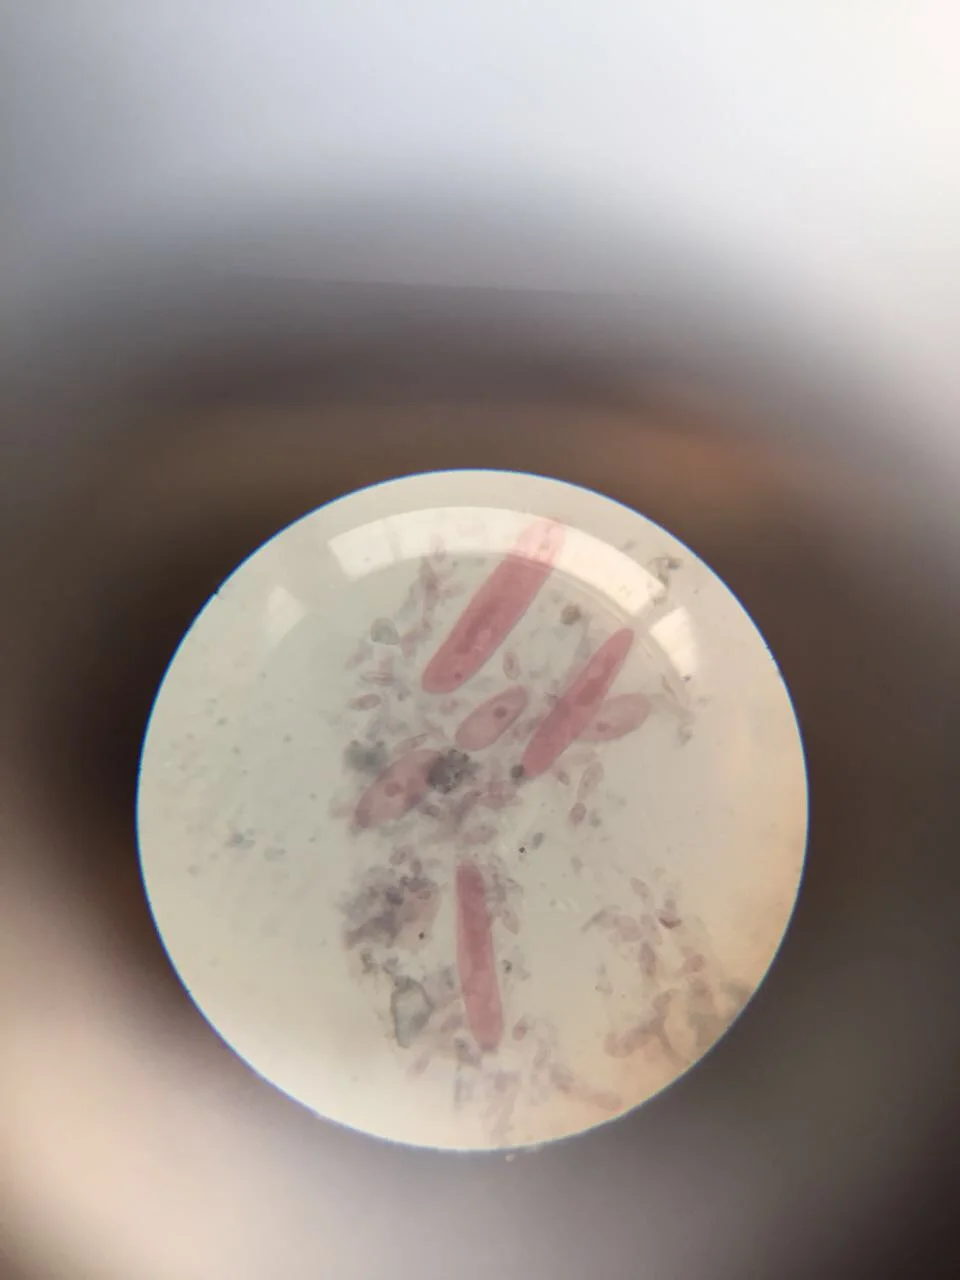
Paramecium: How a Nerve-Like Signal Sends One Cell Backward
Image: “Paramecium 1” by Nbnidhi (2017) · CC BY 4.0
"Paramecium 1" by Nbnidhi — https://commons.wikimedia.org/wiki/File:Paramecium_1.jpg — CC BY 4.0 (https://creativecommons.org/licenses/by/4.0/)
